Uploads by Sw
From CEOpedia | Management online
This special page shows all uploaded files.
| Date | Name | Thumbnail | Size | Description | Versions |
|---|---|---|---|---|---|
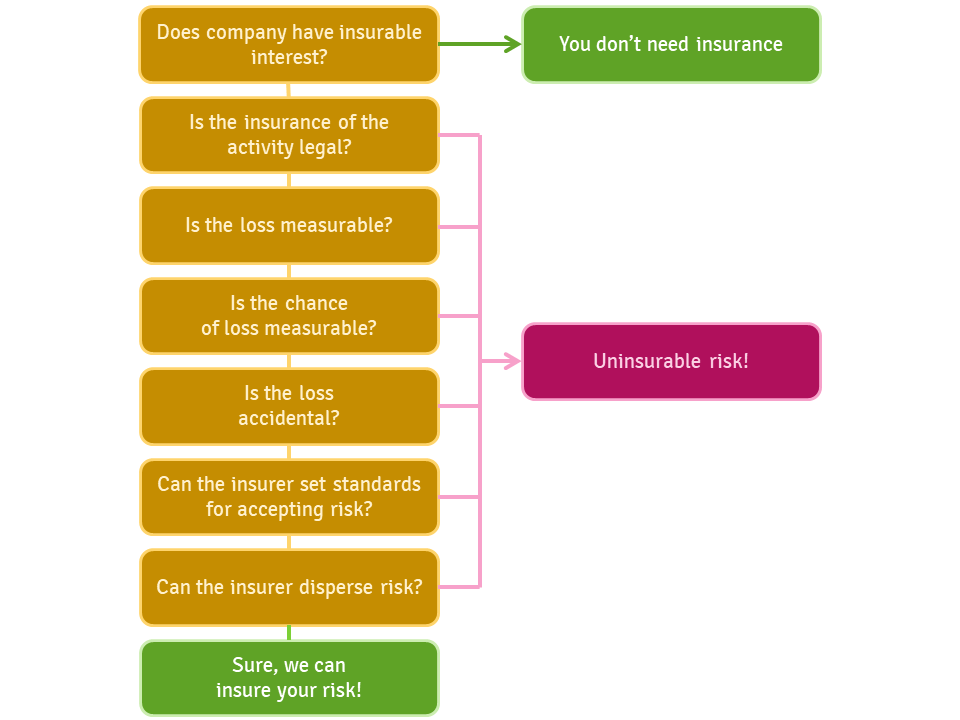
| 10:27, 27 August 2020 | Uninsurable risk.png (file) |  |
33 KB | 1 | |
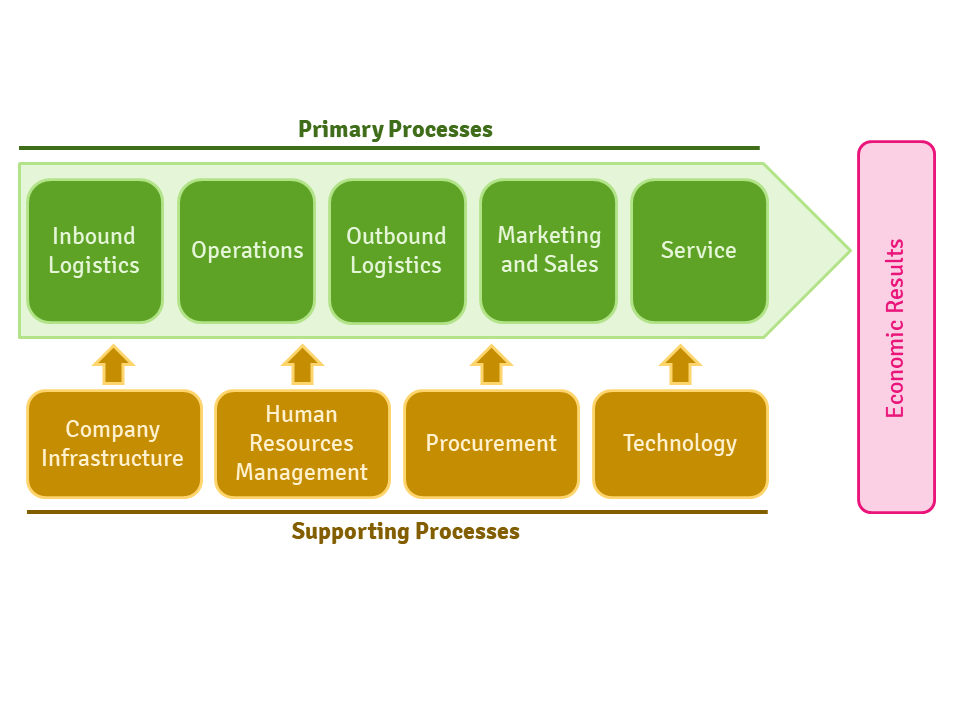
| 10:09, 27 August 2020 | Added value chain.png (file) |  |
26 KB | 1 | |
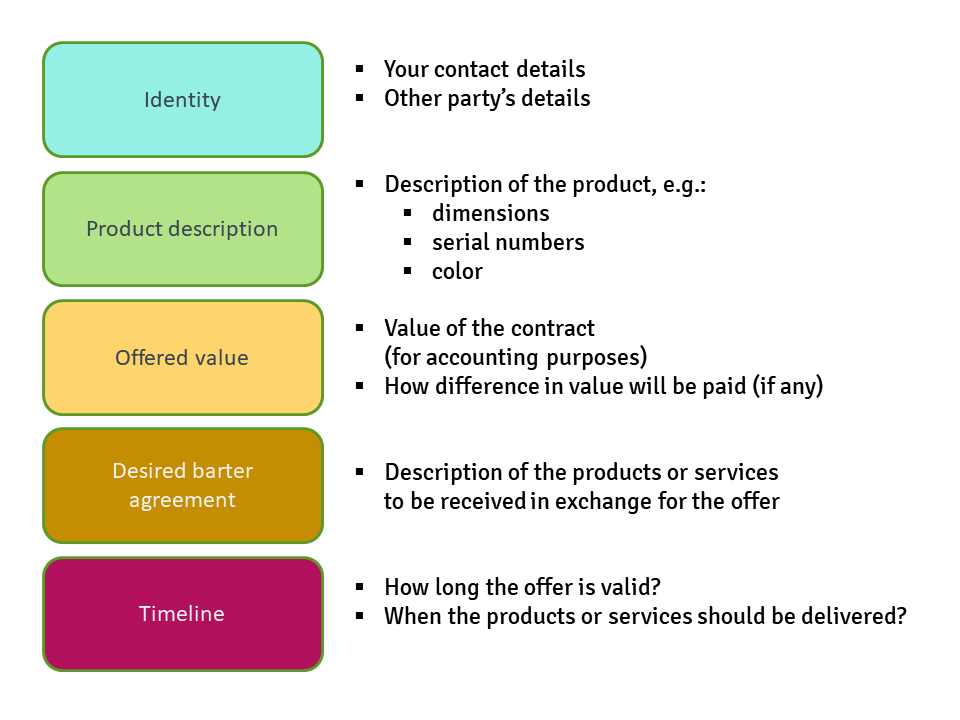
| 09:56, 27 August 2020 | Structure of contra deal.png (file) |  |
36 KB | 1 | |
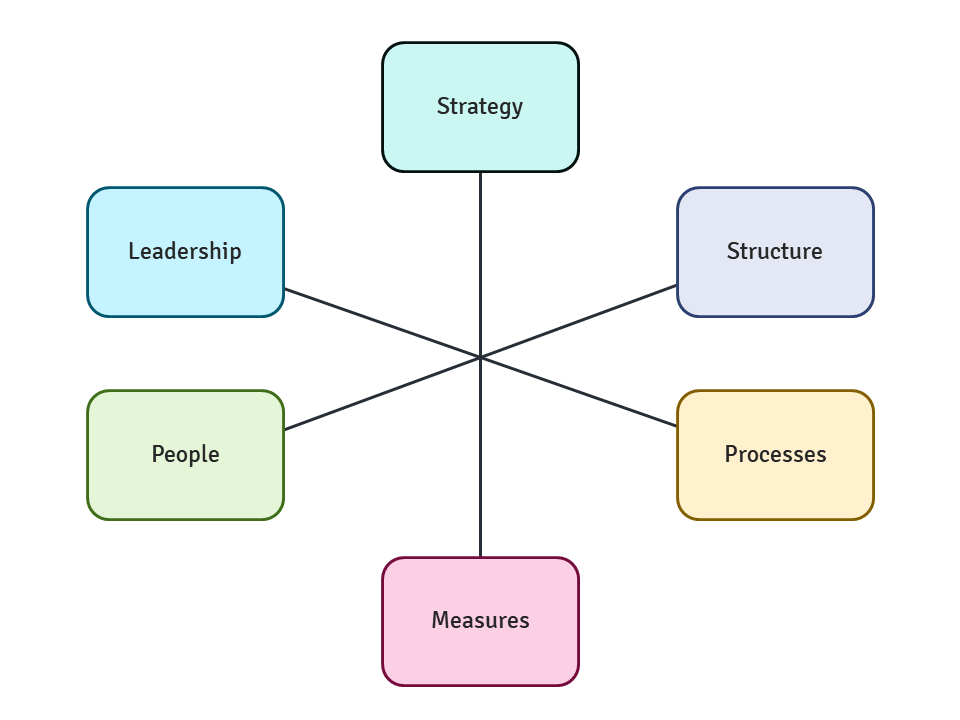
| 09:44, 27 August 2020 | Areas of organizational development.png (file) |  |
23 KB | 1 | |
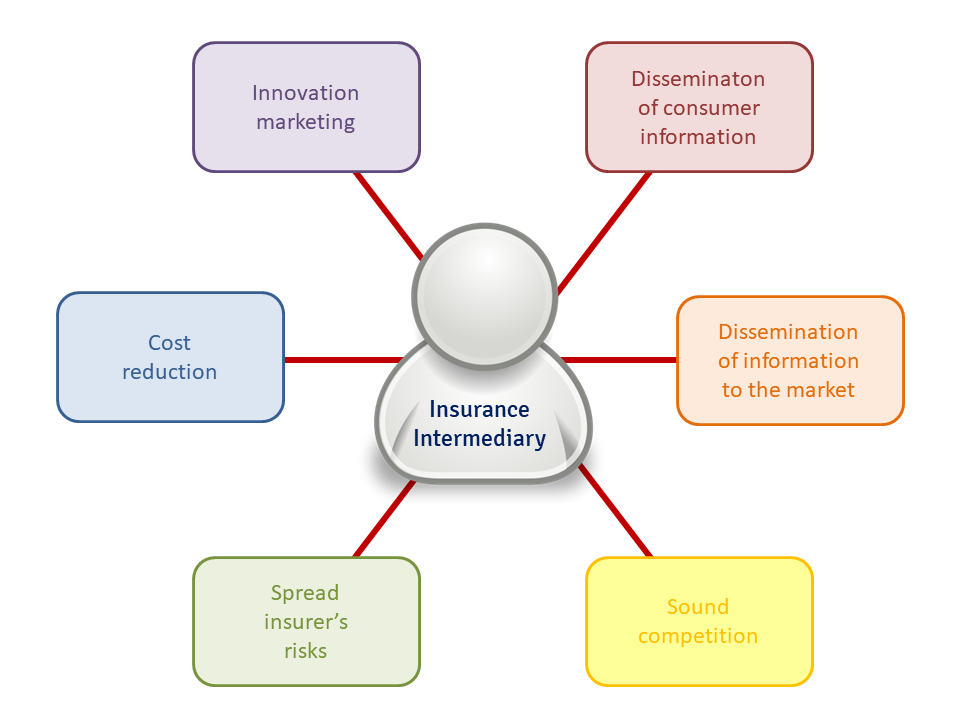
| 16:31, 26 August 2020 | Insurance intermediary.png (file) |  |
70 KB | 1 | |
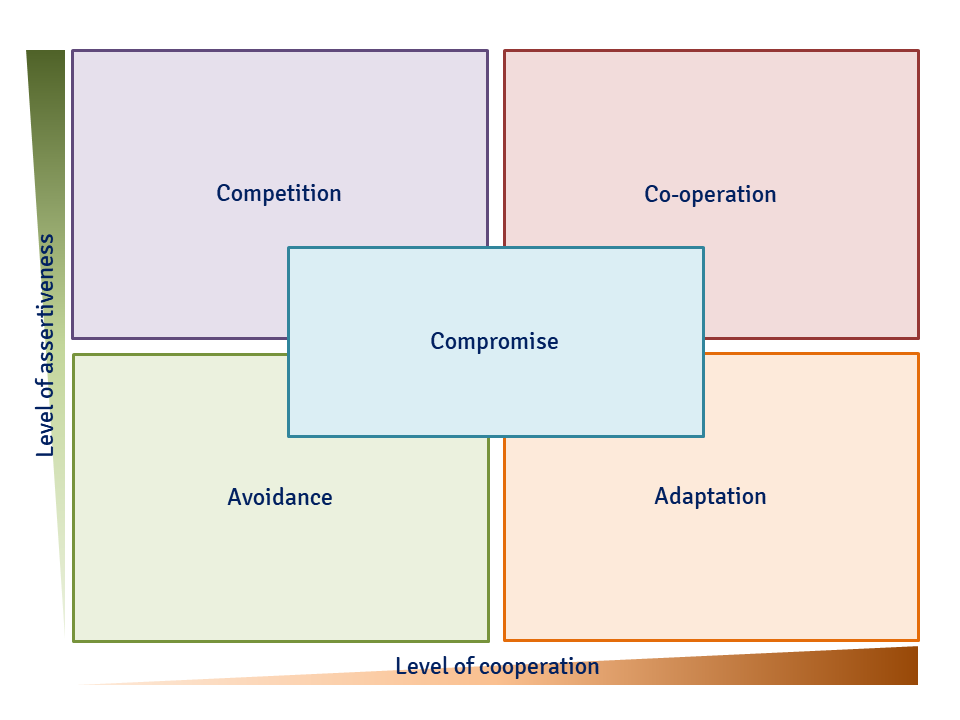
| 16:21, 26 August 2020 | Management by conflict.png (file) |  |
25 KB | 1 | |
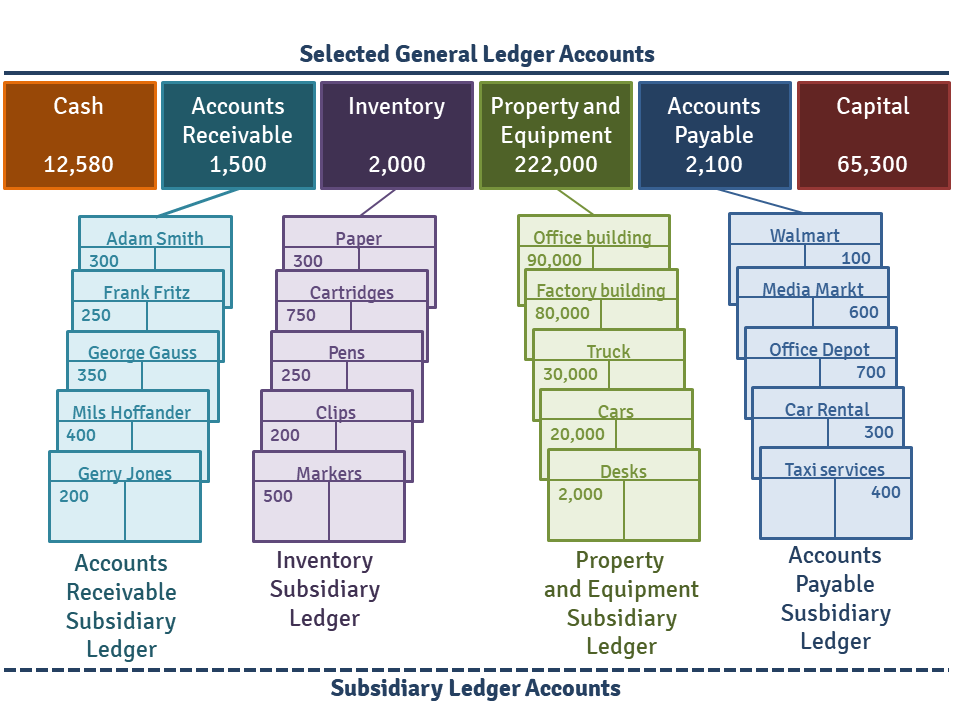
| 16:09, 26 August 2020 | Subsidiary account.png (file) |  |
57 KB | 2 | |
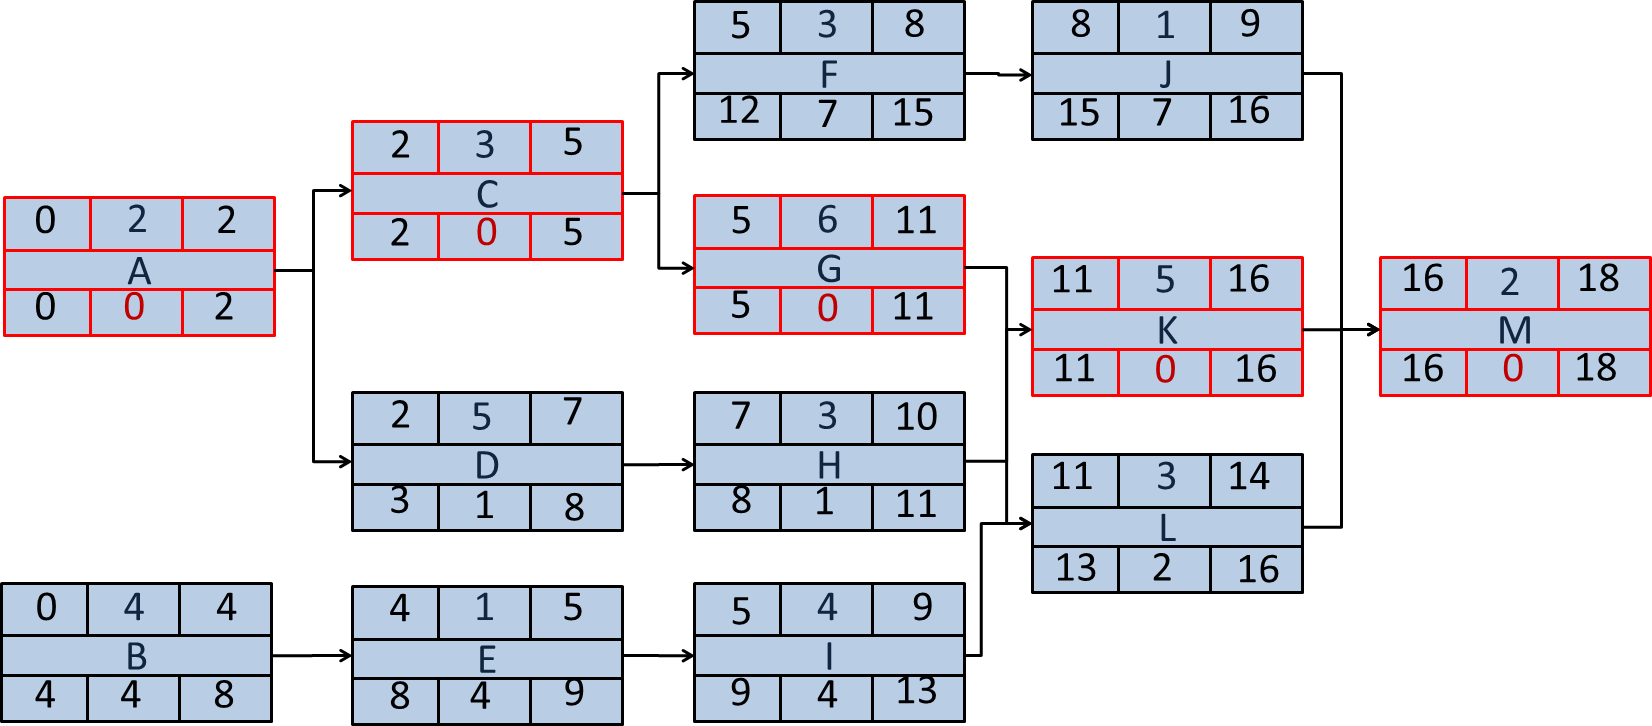
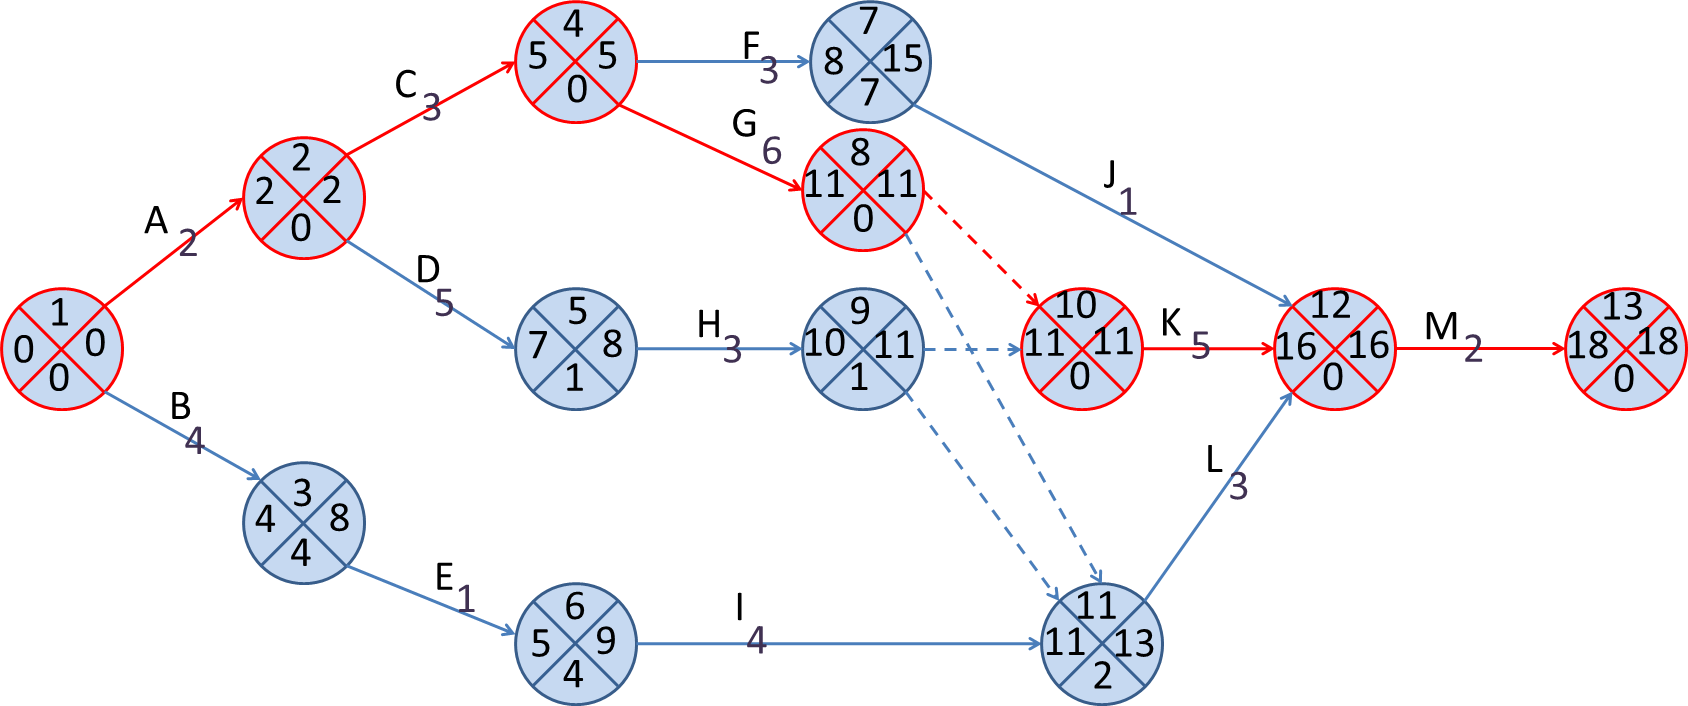
| 15:37, 26 August 2020 | Arrow diagram1.png (file) |  |
30 KB | 1 | |
| 15:37, 26 August 2020 | Arrow diagram2.png (file) |  |
98 KB | 1 | |
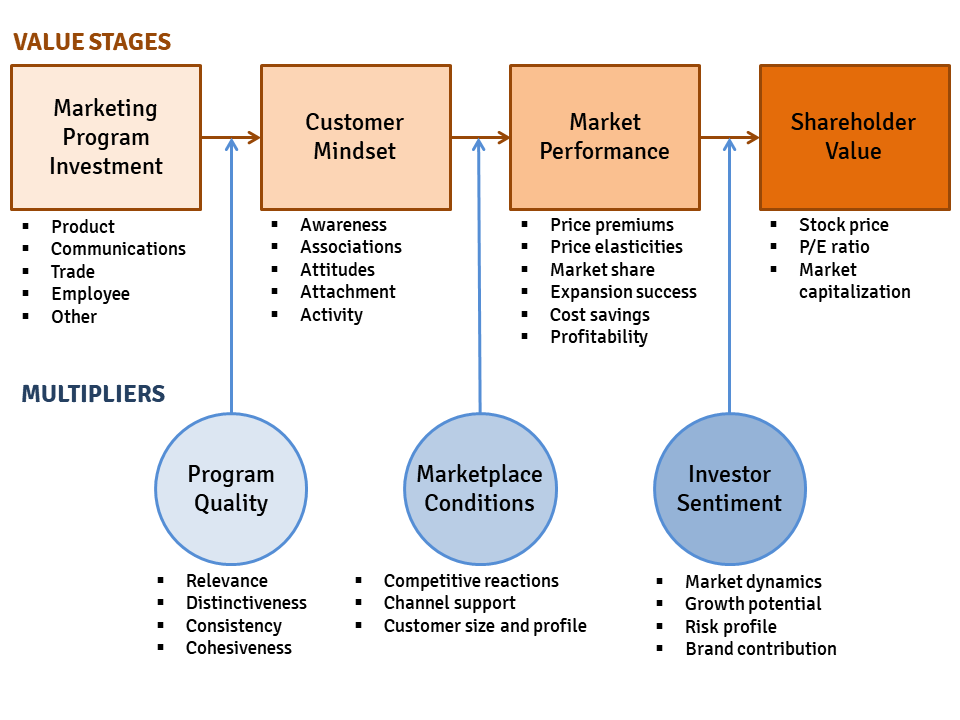
| 15:31, 26 August 2020 | Brand value chain.png (file) |  |
47 KB | 1 | |
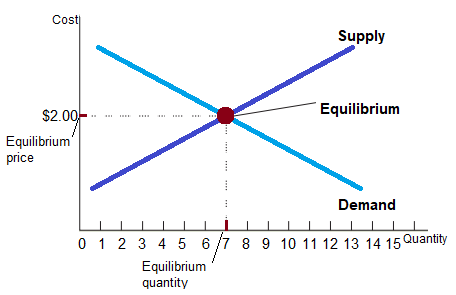
| 07:56, 30 November 2019 | Short run equilibrium.png (file) |  |
10 KB | 1 | |
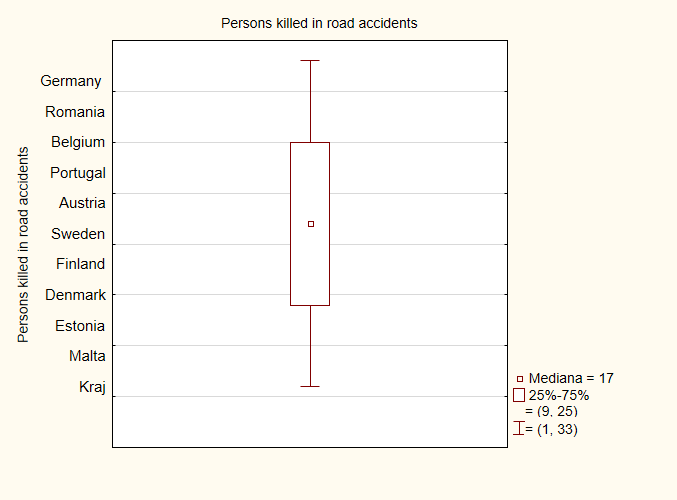
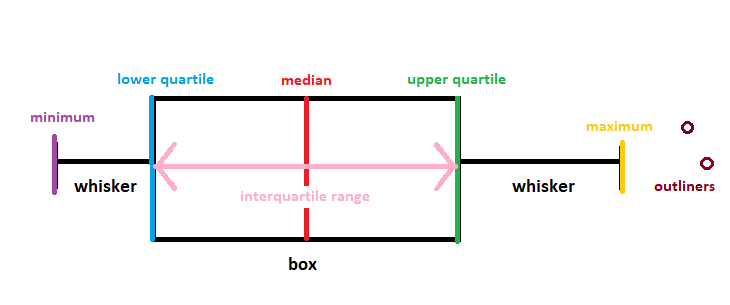
| 11:56, 15 November 2019 | Box diagram2.png (file) |  |
19 KB | 1 | |
| 11:55, 15 November 2019 | Box diagram.png (file) |  |
9 KB | 1 | |
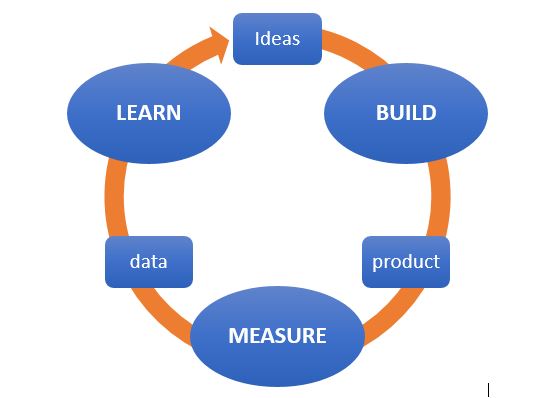
| 09:07, 22 May 2019 | The Build–Measure–Learn loop.jpg (file) |  |
25 KB | 1 | |
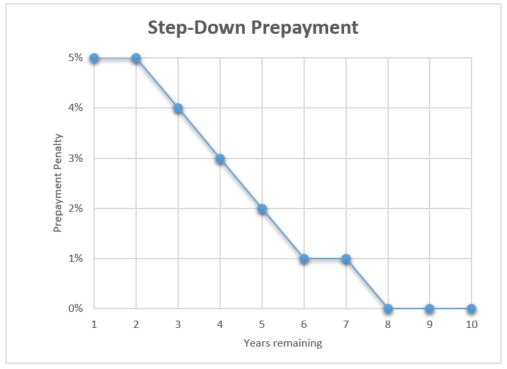
| 16:36, 30 April 2019 | Step-down.jpg (file) |  |
24 KB | 1 | |
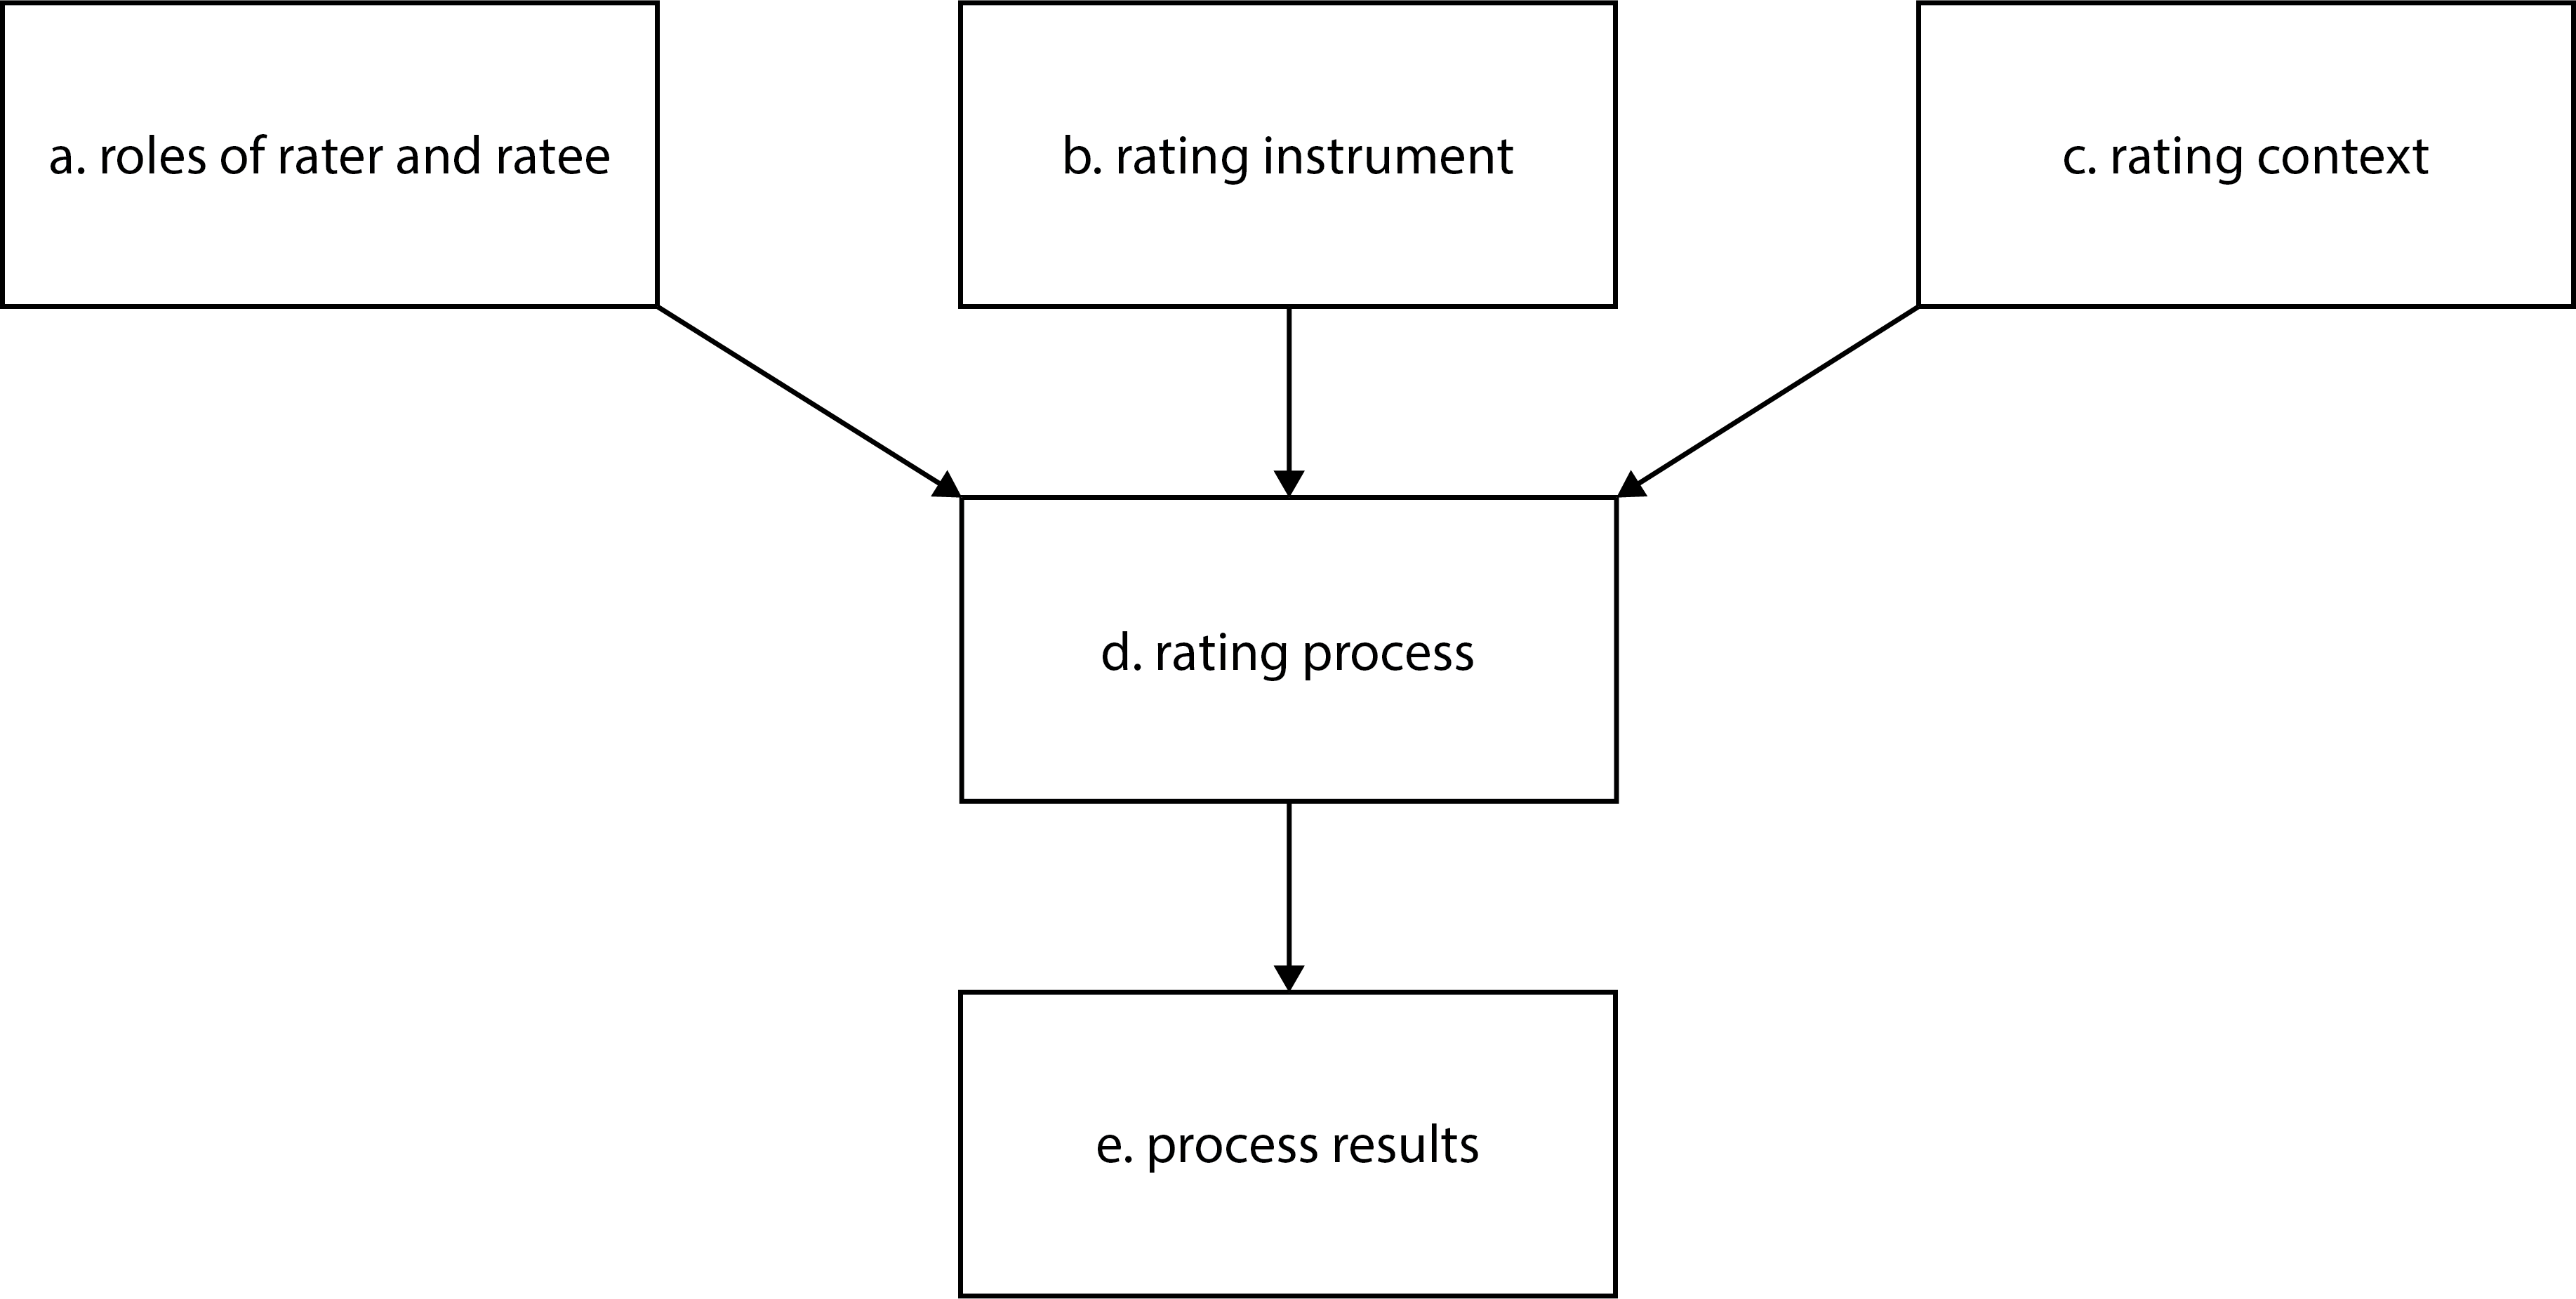
| 20:04, 4 April 2019 | Rating process example component model of performance rating.png (file) |  |
69 KB | 1 | |
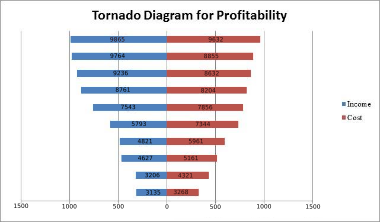
| 07:56, 29 March 2019 | Tornado Diagram for Profitability – example.png (file) |  |
35 KB | 1 | |
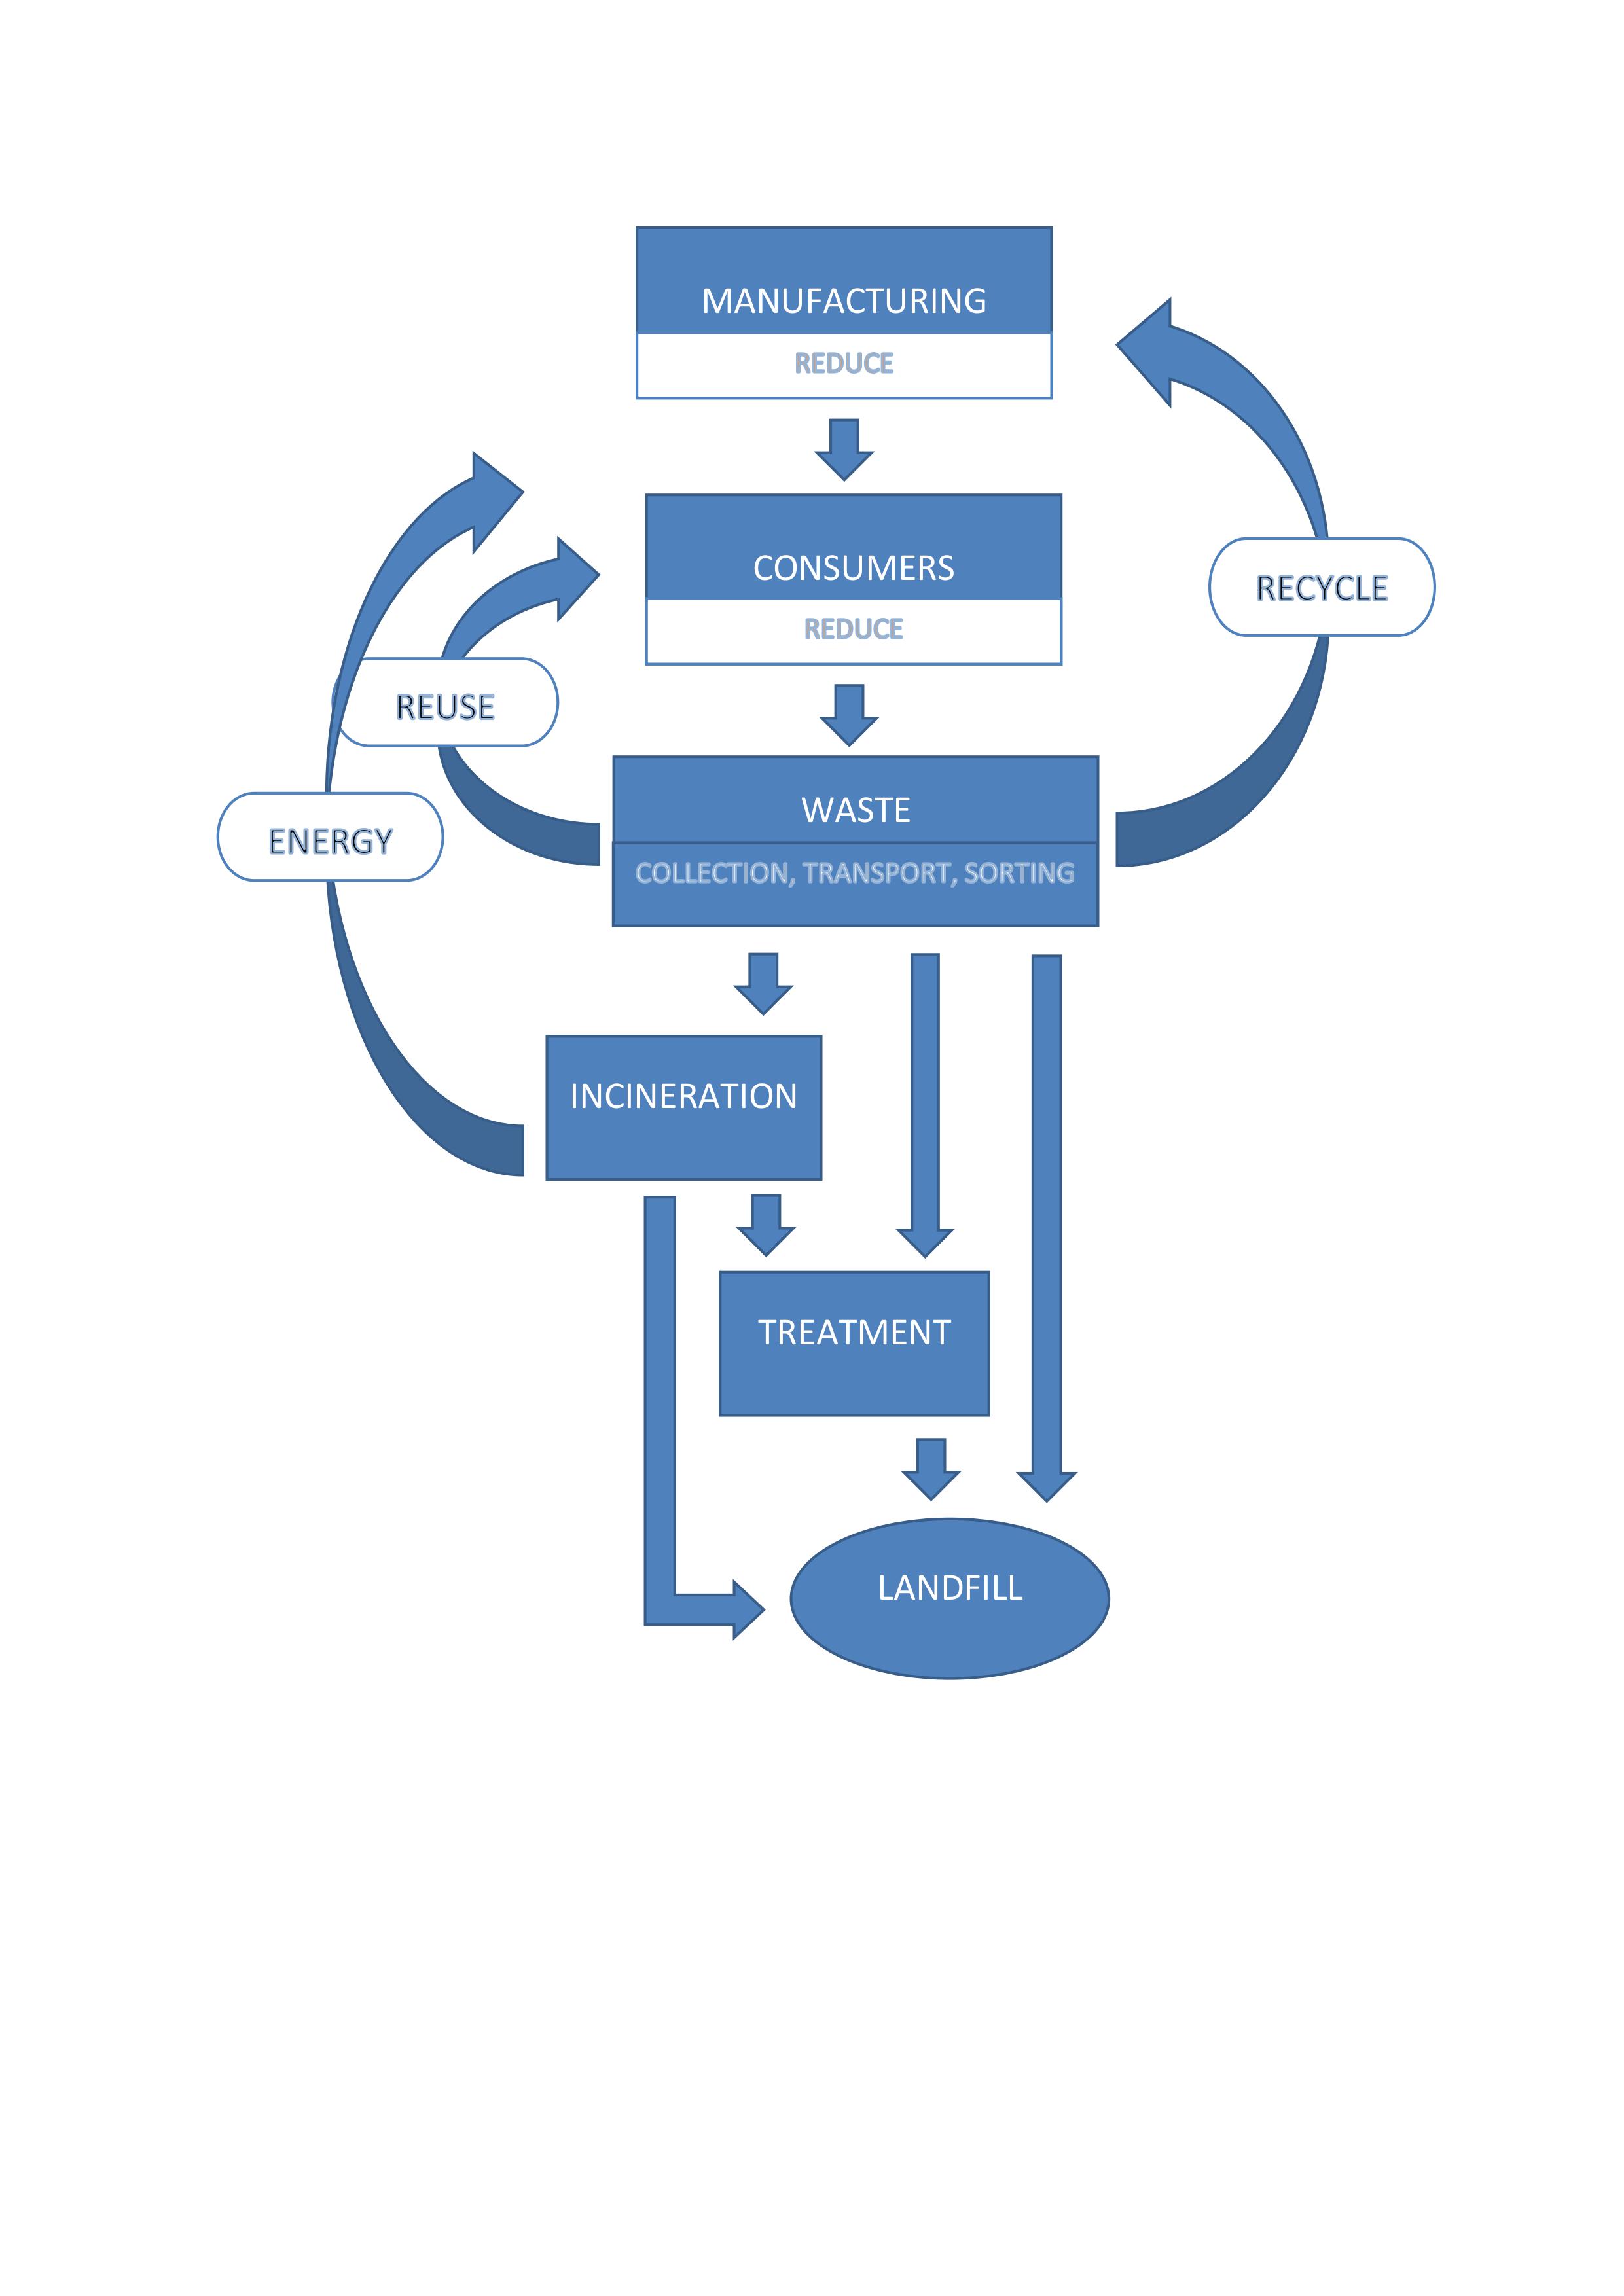
| 17:44, 28 March 2019 | Block diagram illustrating overall integrated waste management system.jpg (file) |  |
252 KB | 1 | |
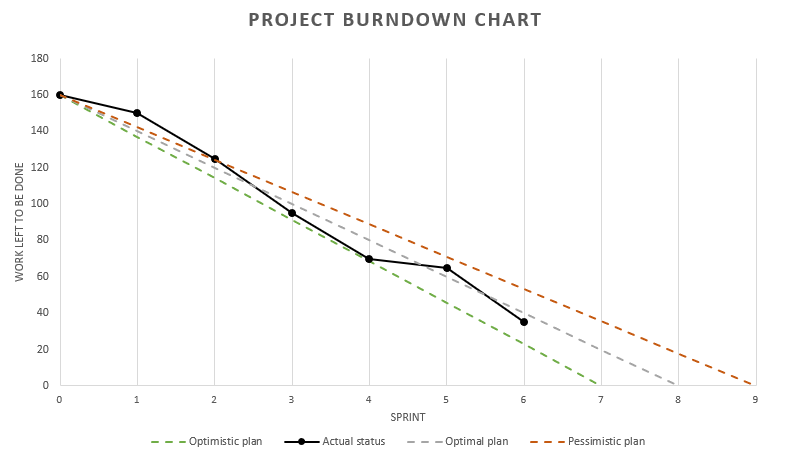
| 18:31, 7 December 2018 | Advanced Burndwon Chart.png (file) |  |
28 KB | 1 | |
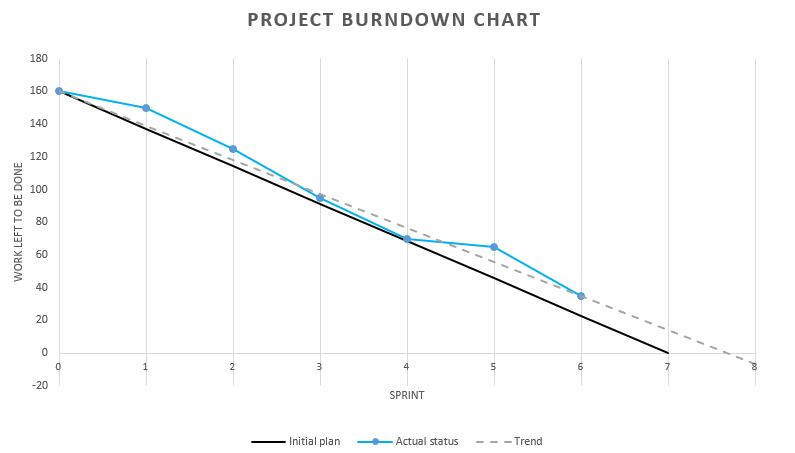
| 18:31, 7 December 2018 | Simple Burndown Chart.png (file) |  |
28 KB | 1 | |
| 18:30, 7 December 2018 | Basic Burndown Chart.png (file) |  |
24 KB | 1 | |
| 13:57, 10 November 2018 | Bmm.png (file) |  |
166 KB | 1 | |
| 15:07, 8 November 2018 | Picture 1.png (file) |  |
67 KB | 1 | |
| 12:20, 27 July 2017 | Gert calculation.png (file) |  |
17 KB | 1 | |
| 12:20, 27 July 2017 | Gert loops.png (file) |  |
21 KB | 1 | |
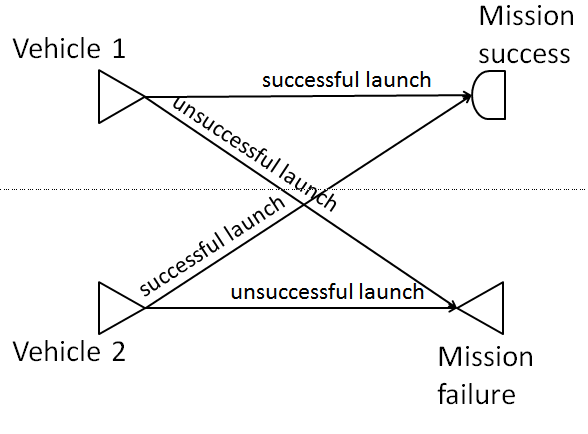
| 12:20, 27 July 2017 | Gert example.png (file) |  |
22 KB | 1 | |
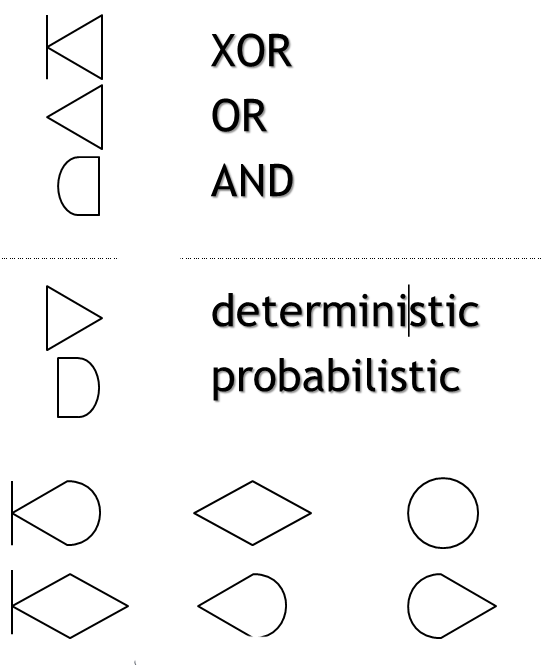
| 12:20, 27 July 2017 | Gert logical operators.png (file) |  |
40 KB | 1 | |
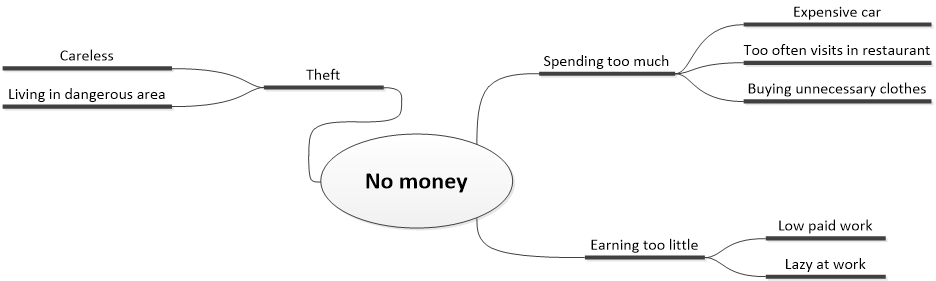
| 12:46, 27 September 2016 | Whywhyanalysis.png (file) |  |
18 KB | 1 | |
| 16:17, 2 April 2016 | Gronroos.jpg (file) |  |
74 KB | 1 | |
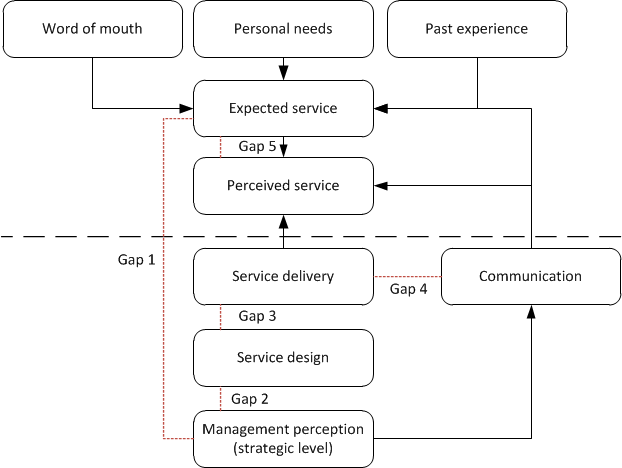
| 15:05, 2 April 2016 | Servqual gaps.png (file) |  |
20 KB | 1 | |
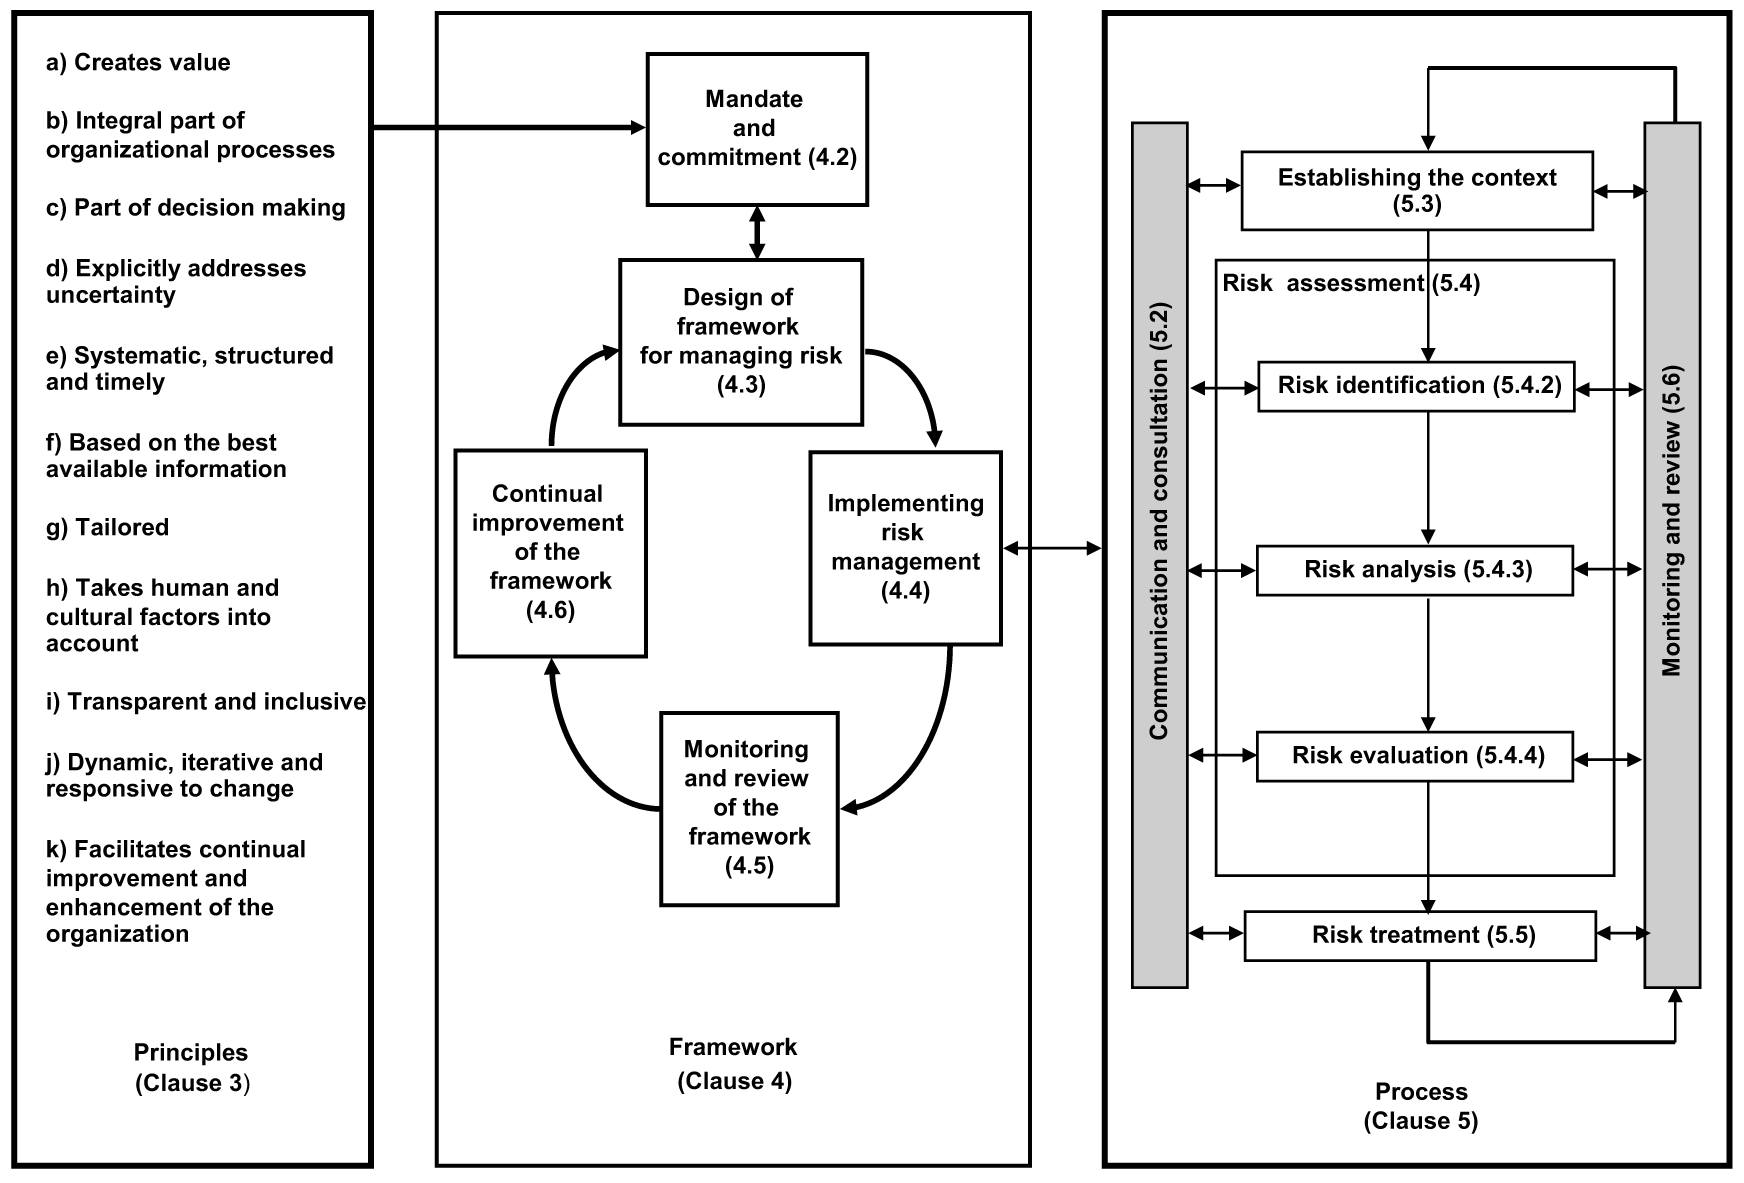
| 08:32, 2 April 2016 | Risk management ISO31000.png (file) |  |
90 KB | 1 | |
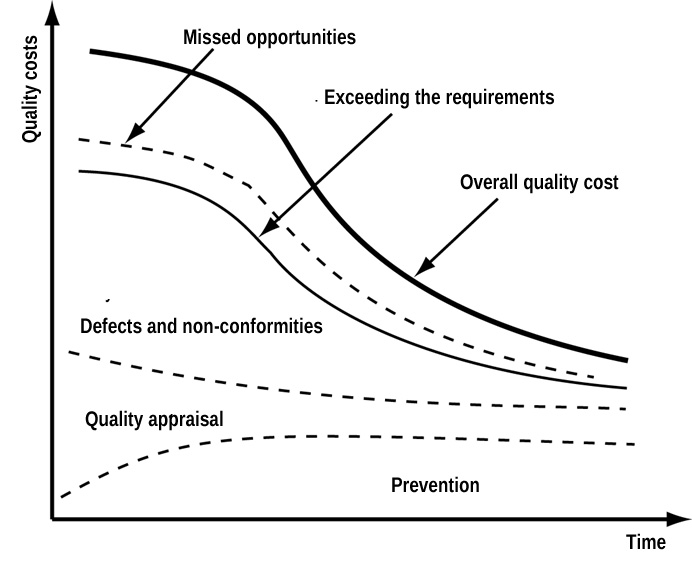
| 11:25, 29 March 2016 | Quality cost2.png (file) |  |
86 KB | 1 | |
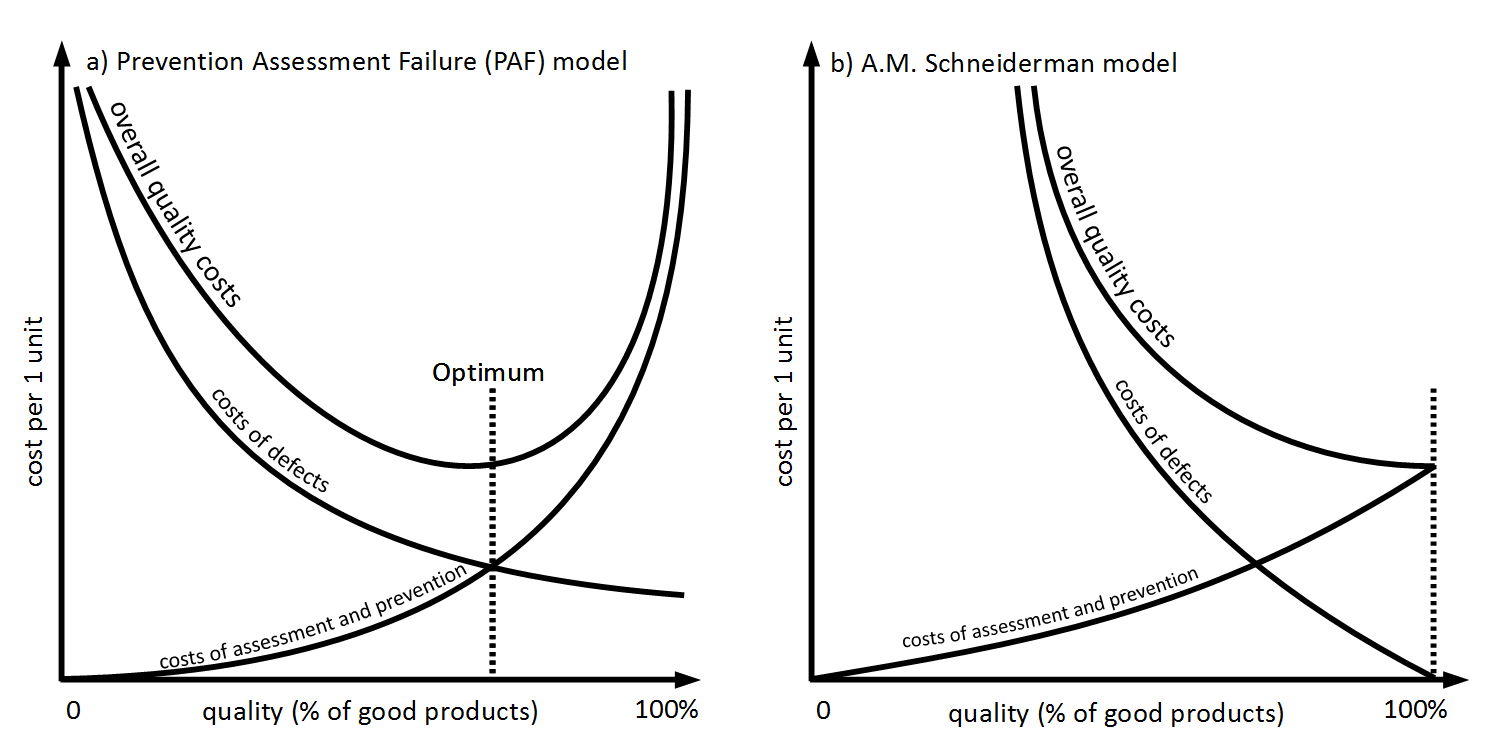
| 11:21, 29 March 2016 | Quality cost1.jpg (file) |  |
67 KB | 1 | |
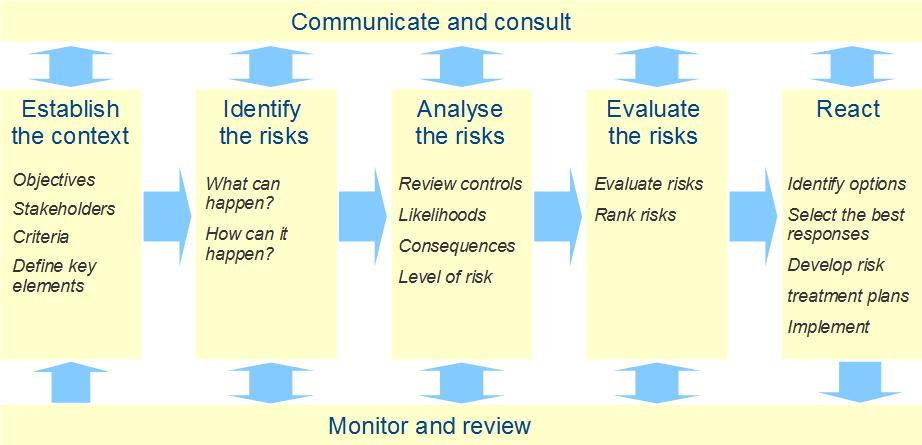
| 18:46, 5 March 2016 | Risk management process.jpg (file) |  |
44 KB | 1 | |
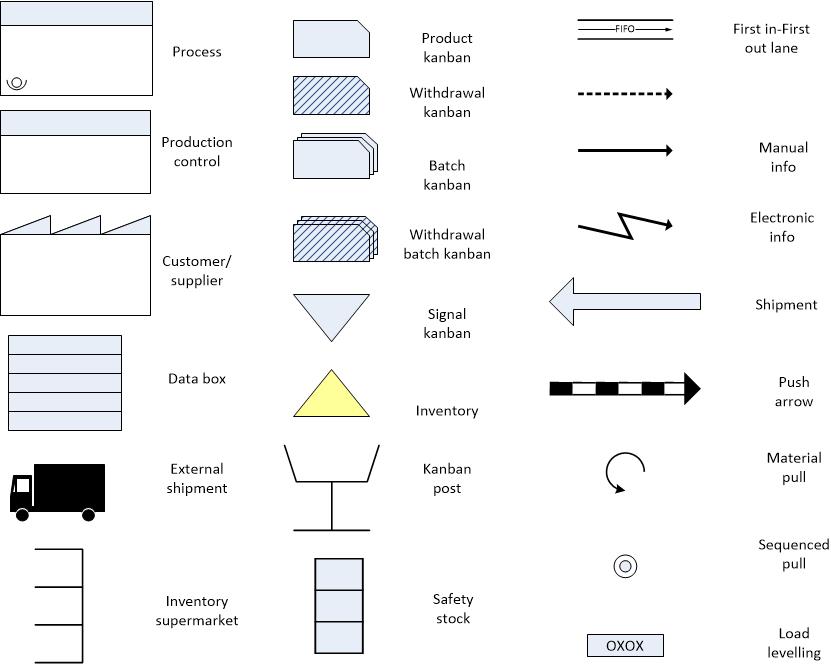
| 17:55, 23 February 2016 | Value stream mapping symbols.jpg (file) |  |
48 KB | 1 | |
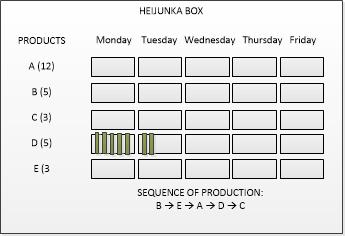
| 22:23, 22 February 2016 | Heijunka box.jpg (file) |  |
15 KB | 1 | |
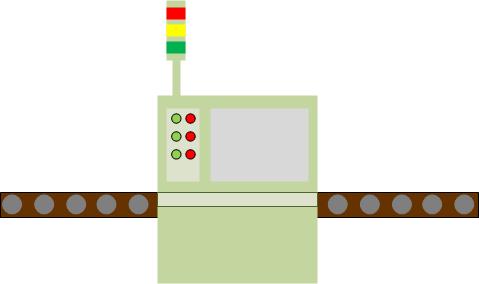
| 19:38, 22 February 2016 | Andon light.jpg (file) |  |
8 KB | 1 | |
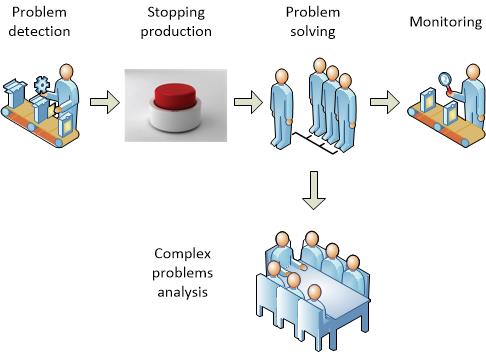
| 19:26, 22 February 2016 | Andon.jpg (file) |  |
22 KB | 1 | |
| 15:02, 20 February 2016 | Silvestro model.jpg (file) |  |
30 KB | 1 | |
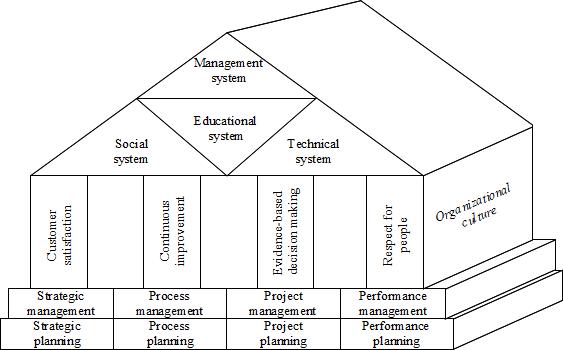
| 13:49, 20 February 2016 | House of total quality.jpg (file) |  |
29 KB | 1 | |
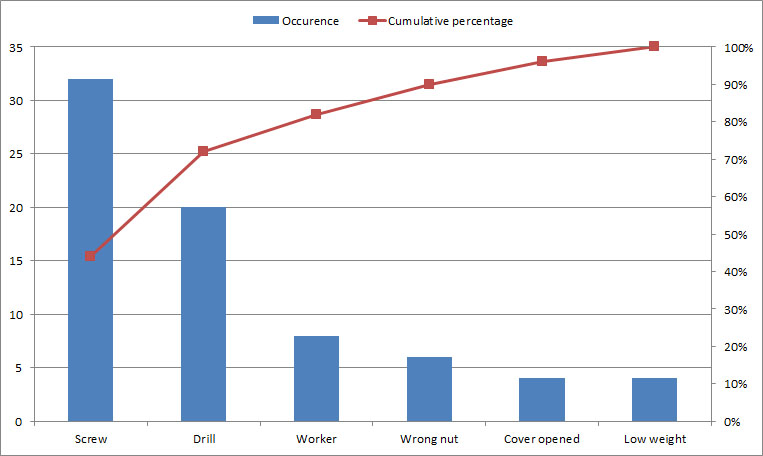
| 20:30, 17 February 2016 | Pareto chart.jpg (file) |  |
64 KB | 1 | |
| 18:33, 15 February 2016 | Armand Feigenbaum.jpg (file) |  |
18 KB | 1 | |
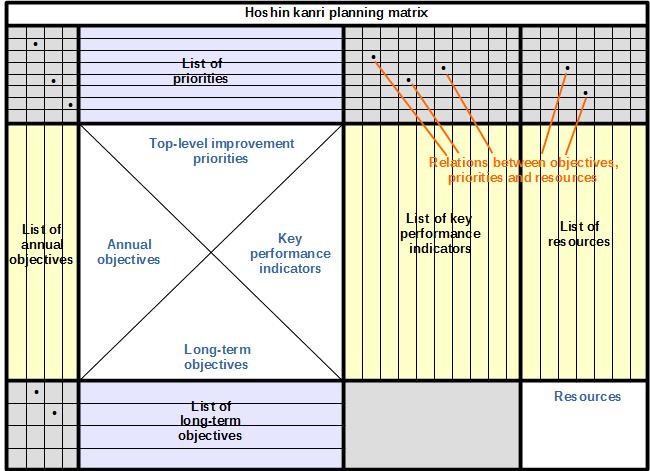
| 16:31, 15 February 2016 | Hoshin matrix.jpg (file) |  |
52 KB | 1 | |
| 16:12, 15 February 2016 | Hoshin kanri.jpg (file) |  |
21 KB | 1 | |
| 17:38, 11 February 2016 | 5S.jpg (file) |  |
38 KB | 1 | |
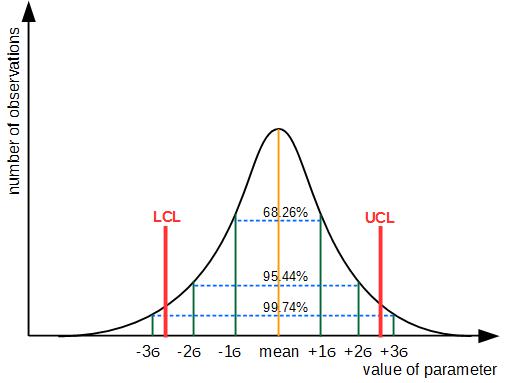
| 20:39, 10 February 2016 | Normal distribution.jpg (file) |  |
16 KB | 1 | |
| 20:31, 10 February 2016 | Six sigma.jpg (file) |  |
12 KB | 1 | |
| 23:31, 9 February 2016 | Quality management system-2015.png (file) |  |
94 KB | 1 | |
| 20:17, 4 February 2016 | Pdca-process-iso-dis-9001-2015.png (file) |  |
254 KB | 1 | |
| 13:42, 3 February 2016 | Center of excellence.jpg (file) |  |
22 KB | 1 |