Uncategorized files
From CEOpedia | Management online
Showing below up to 100 results in range #101 to #200.
 Effective works committee.png 960 × 720; 38 KB
 Elements of organizational culture.png 960 × 720; 19 KB
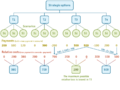
 Encyclopedia of management.png 590 × 80; 22 KB
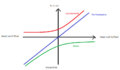
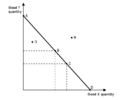
 Equilibrium.jpg 778 × 536; 22 KB
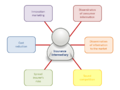
 Ethical factors.png 416 × 370; 55 KB
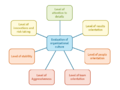 Evaluation of organizational culture.png 960 × 720; 31 KB
 Eve economic value of equity calculation.png 429 × 720; 17 KB
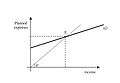
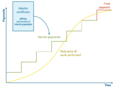
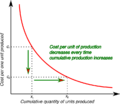 Experience curve.png 754 × 655; 58 KB
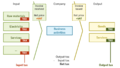
 External environment.png 800 × 444; 38 KB
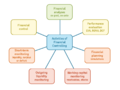 Financial controlling activities.png 960 × 720; 35 KB
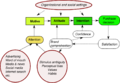
 Fishbein model.png 909 × 804; 78 KB
 Functional structure.png 641 × 282; 19 KB
 Functions of research.png 1,024 × 582; 80 KB
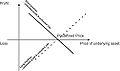 Futures.jpg 501 × 295; 13 KB
 G Taguchi.gif 126 × 160; 18 KB
 Gary S. Becker.jpg 230 × 230; 7 KB
 German model of corporate governance.png 960 × 720; 24 KB
 Gert calculation.png 518 × 376; 17 KB
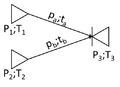
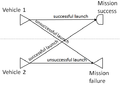 Gert example.png 588 × 434; 22 KB
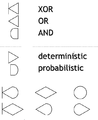 Gert logical operators.png 541 × 665; 40 KB
 Gert loops.png 1,379 × 417; 21 KB
 Governance.png 640 × 493; 187 KB
 Gronroos.jpg 1,000 × 623; 74 KB
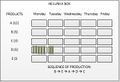 Heijunka box.jpg 345 × 236; 15 KB
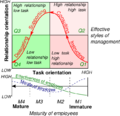 Hersey and Blanchard model.png 666 × 645; 116 KB
 Hierarchy of effects model.png 936 × 767; 95 KB
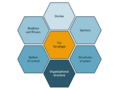
 Hierarchy of strategies.png 930 × 654; 57 KB
 High involvement product.png 960 × 720; 23 KB
 Hofer matrix.png 861 × 601; 117 KB
 Hoshin kanri.jpg 548 × 312; 21 KB
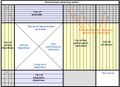 Hoshin matrix.jpg 650 × 471; 52 KB
 Hospitality product quality.png 960 × 720; 34 KB
 Hospitality services quality.png 710 × 531; 158 KB
 Hotel rating.png 202 × 186; 21 KB
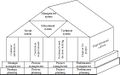 House of total quality.jpg 563 × 350; 29 KB
 Howard Sheth model.png 1,090 × 753; 120 KB
 IMF-lending chart.gif 520 × 477; 20 KB
 IMFheadq.jpg 500 × 395; 288 KB
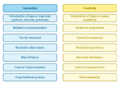 Innocvation vs creativity.png 960 × 720; 38 KB
 Input output tax.png 960 × 546; 35 KB
 Insurance intermediary.png 960 × 720; 70 KB
 Interim certificate and payments.png 960 × 720; 27 KB
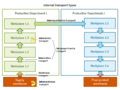 Internal transport.png 960 × 720; 49 KB
 Japanese model of corporate governance.png 960 × 720; 28 KB
 Juran.gif 120 × 160; 16 KB
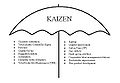 KAIZEN.jpg 639 × 444; 33 KB
 K Ishkawa.gif 120 × 171; 18 KB
 Kanodiagram.png 832 × 486; 71 KB
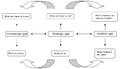 Knowledge gap concept.jpg 632 × 365; 34 KB
 Korelacja Diagram.jpg 472 × 281; 13 KB
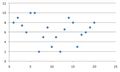 Korelacja brak.jpg 471 × 283; 11 KB
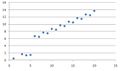
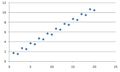 Korelacja dodatnia.jpg 471 × 281; 11 KB
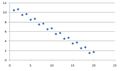 Korelacja ujemna.jpg 476 × 283; 12 KB
 Krzysztof Wozniak.jpg 800 × 932; 139 KB
 Lateral diversification.png 1,065 × 372; 46 KB
 Leavitt organization model.png 711 × 326; 86 KB
 Legal factors.png 353 × 374; 43 KB
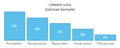 Lehman formula.png 960 × 383; 10 KB
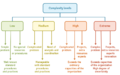 Levels of complexity.png 960 × 603; 47 KB
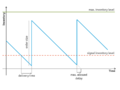
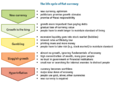 Life cycle of fiat currency.png 960 × 720; 46 KB
 Line of credit types.png 960 × 720; 32 KB
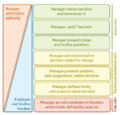
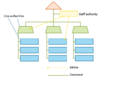 Line vs staff authority.png 960 × 720; 20 KB
 Linear organizational structure.png 671 × 321; 15 KB
 Linear production capacity curve.png 660 × 550; 10 KB
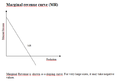 MR Curve.png 633 × 436; 13 KB
 Management by conflict.png 960 × 720; 25 KB
 Management by participation.png 960 × 720; 31 KB
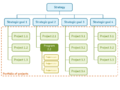 Management by projects.png 960 × 720; 26 KB
 Management by results.png 960 × 359; 16 KB
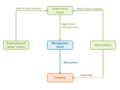
 Management of development.gif 644 × 411; 12 KB
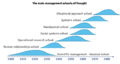 Management schools of thought.png 960 × 511; 19 KB
 Management styles authority vs freedom.png 749 × 720; 55 KB
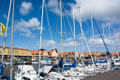 Marine tourism.jpg 1,024 × 683; 179 KB
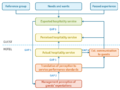
 Marketing plan control process.png 1,279 × 885; 97 KB
 Marketing strategy elements.png 660 × 720; 17 KB
 Maslow hierarchy of needs.jpg 782 × 381; 47 KB
 McKinsey matrix.png 638 × 632; 112 KB
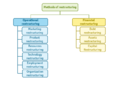 Methods of restructuring.png 960 × 720; 35 KB
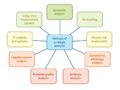 Methods of strategic analysis.png 960 × 720; 36 KB
 Mfiles logo.png 180 × 66; 9 KB
 Minimax criterion.png 960 × 720; 39 KB
 Mobility barriers.png 339 × 234; 34 KB
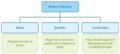 Modes of delivery.png 960 × 430; 21 KB
 Money emission.png 690 × 728; 77 KB
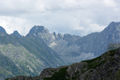 Mountain tourism.jpg 1,024 × 683; 141 KB
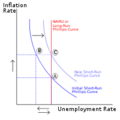 NAIRU-SR-and-LR.png 200 × 200; 8 KB
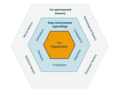 Near and far environment.png 960 × 720; 35 KB
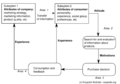 Nicosia model of consumer behaviour.png 1,222 × 859; 141 KB
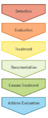 Non-conformity management.png 292 × 720; 13 KB
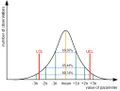 Normal distribution.jpg 507 × 383; 16 KB
 Objectives of the organization.png 1,073 × 810; 88 KB
 Opportunities.png 506 × 441; 60 KB
 Optimum size of order.png 960 × 720; 11 KB
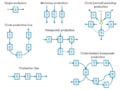 Organization of production.png 960 × 720; 22 KB
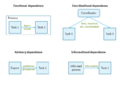 Organizational dependencies.png 960 × 720; 25 KB
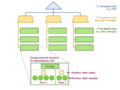 Organizational structure.png 960 × 720; 30 KB
 PDCA.jpg 119 × 129; 5 KB
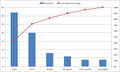 Pareto chart.jpg 763 × 456; 64 KB
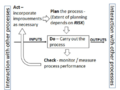 Pdca-process-iso-dis-9001-2015.png 688 × 515; 254 KB
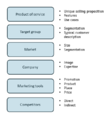
 Pest.jpg 590 × 260; 20 KB


