Uncategorized files
From CEOpedia | Management online
Showing below up to 100 results in range #201 to #300.
 Picture 1.png 1,123 × 794; 67 KB
 Planning vs control.png 651 × 368; 58 KB
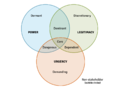
 Political factors.png 489 × 457; 80 KB
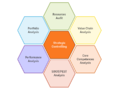
 Porter5.jpg 519 × 471; 25 KB
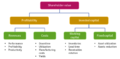
 Pricing strategies.png 865 × 368; 44 KB
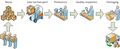
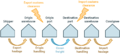
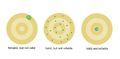
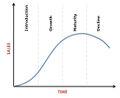 Product-life-cycle-stages-plc.jpg 584 × 476; 22 KB
 Production line.png 960 × 720; 28 KB
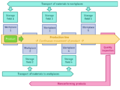
 Production process.jpg 672 × 274; 29 KB
 Project Lifecycle.gif 700 × 324; 8 KB
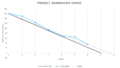
 Project evaluation methods.png 1,024 × 346; 64 KB
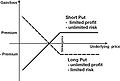 Put.jpg 406 × 274; 14 KB
 Qfd1.jpg 471 × 707; 53 KB
 Qfd2.jpg 474 × 690; 71 KB
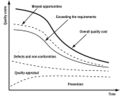 Quality cost1.jpg 692 × 576; 67 KB
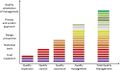
 Quality cost2.png 1,499 × 750; 86 KB
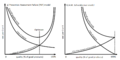
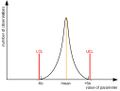
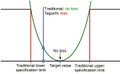 Quality loss function.jpg 723 × 448; 40 KB
 Quality management development.jpg 998 × 588; 61 KB
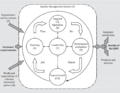 Quality management system-2015.png 1,159 × 896; 94 KB
 Quality of public administration.png 342 × 336; 55 KB
 Rating process example component model of performance rating.png 3,670 × 1,850; 69 KB
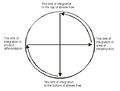
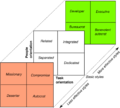 Reddin box.png 994 × 892; 90 KB
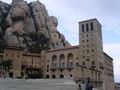 Religious tourism.jpg 1,024 × 768; 167 KB
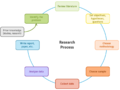 Research process.png 960 × 720; 35 KB
 Revenue center.png 960 × 720; 23 KB
 Risk management ISO31000.png 1,744 × 1,183; 90 KB
 Risk management process.jpg 922 × 445; 44 KB
 STEEPLE analysis.png 582 × 514; 49 KB
 STEEP analysis.png 595 × 514; 47 KB
 SWOT matrix.png 740 × 631; 98 KB
 SalesPotential.jpg 1,123 × 794; 42 KB
 Salience model.png 960 × 720; 44 KB
 Servqual gaps.png 622 × 468; 20 KB
 Shareholder value added.png 960 × 472; 23 KB
 Shewhart.gif 108 × 136; 4 KB
 Shipping process.png 960 × 451; 31 KB
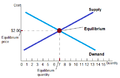 Short run equilibrium.png 456 × 295; 10 KB
 Significance of strategy.png 960 × 720; 35 KB
 Silvestro model.jpg 592 × 592; 30 KB
 Simple Burndown Chart.png 795 × 453; 28 KB
 Six sigma.jpg 507 × 383; 12 KB
 Slawomir Wawak 2.jpg 300 × 300; 58 KB
 Social and cultural factors affecting business.png 1,024 × 397; 60 KB
 Staff structure.png 805 × 344; 20 KB
 State administration features.png 960 × 720; 39 KB
 Statement of profit and loss.png 960 × 720; 24 KB
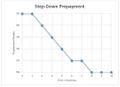 Step-down.jpg 507 × 369; 24 KB
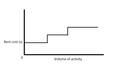 Step fixed cost.png 597 × 353; 4 KB
 Strategic Business Units.png 790 × 606; 59 KB
 Strategic controlling.png 960 × 720; 23 KB
 Strategic cost management process.png 960 × 720; 36 KB
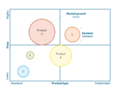 Strategic groups map.png 960 × 720; 36 KB
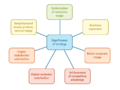
 Strategic management functions.png 930 × 1,001; 98 KB
 Strategic management model.gif 517 × 675; 11 KB
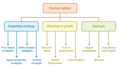 Strategic options.png 960 × 532; 31 KB
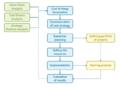
 Strategic planning process.gif 625 × 877; 48 KB
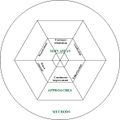
 Strategy wheel.jpg 565 × 430; 35 KB
 Strauss-kahn.jpg 900 × 704; 68 KB
 Strengths.png 321 × 332; 15 KB
 Structure follows strategy.png 960 × 380; 28 KB
 Structure of contra deal.png 960 × 720; 36 KB
 Subsidiary account.png 960 × 720; 57 KB
 Supply logistics subsystem.png 960 × 371; 14 KB
 Swap2.jpg 648 × 77; 7 KB
 System approach to project management.png 960 × 720; 37 KB
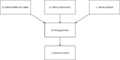
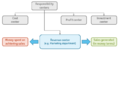
 Systemic approach to change.png 502 × 209; 16 KB
 TOWS TimeDimension.png 1,094 × 665; 47 KB
 TOWS matrix.png 1,020 × 918; 133 KB
 TOWS procedure.png 1,165 × 1,134; 163 KB
 Taxes.png 640 × 475; 229 KB
 Team members selection.png 960 × 720; 38 KB
 Technological factors.png 358 × 340; 24 KB
 Test validity.png 2,050 × 1,000; 31 KB
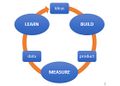 The Build–Measure–Learn loop.jpg 558 × 398; 25 KB
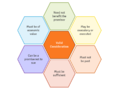
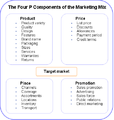 The Four P Components.png 469 × 495; 19 KB
 Threats.png 425 × 381; 15 KB
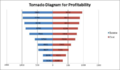 Tornado Diagram for Profitability – example.png 380 × 222; 35 KB
 Tourism types.png 960 × 479; 17 KB
 Types of Doji.jpeg 1,024 × 512; 58 KB
 Types of Doji.png 1,024 × 512; 76 KB
 Types of quality certificates.png 960 × 720; 35 KB
 Types of quality parameters.png 960 × 720; 31 KB
 Types of segmented pricing.png 980 × 462; 61 KB
 Uncertainty avoidance.png 571 × 332; 44 KB
 Uninsurable risk.png 960 × 720; 33 KB
 Unity of command vs direction.png 960 × 720; 15 KB
 Urban tourism.jpg 1,024 × 895; 237 KB
 Uwaga.png 70 × 65; 4 KB
 Valid executed or executory consideration.png 960 × 720; 24 KB
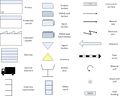 Value stream mapping symbols.jpg 831 × 664; 48 KB
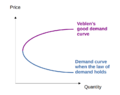 Veblencurve.png 782 × 621; 48 KB
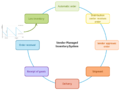 Vendor managed inventory system.png 960 × 720; 37 KB
 Vertical communication.png 1,024 × 637; 53 KB
 Vertical diversification.png 683 × 722; 46 KB
 WE Deming.jpg 154 × 181; 11 KB
 Weaknesses.png 447 × 331; 29 KB
 Whywhyanalysis.png 936 × 281; 18 KB
 Work improvement.png 813 × 717; 18 KB
 Work sample tests.png 960 × 317; 26 KB
 Wykres.png 897 × 501; 8 KB
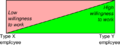 X Y employee.png 681 × 258; 26 KB


