Uncategorized files
From CEOpedia | Management online
Showing below up to 300 results in range #1 to #300.
 1.jpg 801 × 238; 27 KB
 13 types of organizational documents.png 960 × 720; 41 KB
 5S.jpg 352 × 336; 38 KB
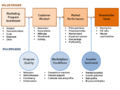
 5 forces model.jpg 724 × 457; 29 KB
 AIDA model.png 937 × 623; 74 KB
 AStar algorithm.gif 565 × 323; 46 KB
 Ability to work in a team.png 960 × 720; 31 KB
 Accounting principles.png 960 × 720; 23 KB
 Added value chain.png 960 × 720; 26 KB
 Adjusted mean.png 651 × 289; 9 KB
 Adopters.png 945 × 465; 41 KB
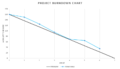
 Advanced Burndwon Chart.png 793 × 458; 28 KB
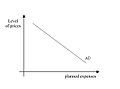 Aggregated line of demand.jpg 676 × 501; 16 KB
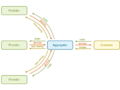 Aggregator model.png 960 × 720; 34 KB
 Algorithm scheme.gif 344 × 104; 4 KB
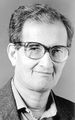 Amartya Sen.jpg 200 × 320; 17 KB
 Andon.jpg 486 × 352; 22 KB
 Andon light.jpg 479 × 284; 8 KB
 Areas of organizational development.png 960 × 720; 23 KB
 Armand Feigenbaum.jpg 207 × 239; 18 KB
 Arrow diagram1.png 1,652 × 726; 30 KB
 Arrow diagram2.png 1,688 × 706; 98 KB
 At work.png 60 × 60; 4 KB
 Authorized shares.png 927 × 303; 7 KB
 BCG Matrix.png 622 × 521; 106 KB
 BCG method.jpg 515 × 246; 22 KB
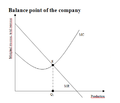 Balance point.png 449 × 385; 16 KB
 Bargaining power of buyers.png 960 × 590; 30 KB
 Basic Burndown Chart.png 793 × 458; 24 KB
 Basic accounting concepts.png 960 × 720; 37 KB
 Batch picking.png 960 × 720; 32 KB
 Baumol model.png 1,024 × 654; 41 KB
 Bear Flag 2000px.jpg 2,000 × 1,348; 218 KB
 Bettman model.png 546 × 365; 30 KB
 Bin card.png 960 × 468; 12 KB
 Bis-headquarters.jpg 624 × 940; 195 KB
 Blake Mouton grid.png 619 × 527; 93 KB
 Block diagram illustrating overall integrated waste management system.jpg 2,481 × 3,508; 252 KB
 Bmm.png 1,123 × 794; 166 KB
 Box diagram.png 730 × 305; 9 KB
 Box diagram2.png 677 × 500; 19 KB
 Brand innovation.png 960 × 303; 31 KB
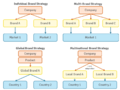 Brand strategies.png 960 × 720; 32 KB
 Brand value chain.png 960 × 720; 47 KB
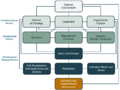 Burke-litwin model.png 960 × 720; 37 KB
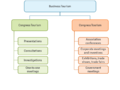
 Business justification.png 1,024 × 987; 71 KB
 Business tourism.png 960 × 720; 32 KB
 C.E.Shannon.jpg 200 × 282; 7 KB
 CPM diagram.jpg 1,313 × 537; 94 KB
 Cafeteria system.png 960 × 720; 32 KB
 Call.jpg 406 × 274; 14 KB
 Carding forum.png 893 × 377; 30 KB
 Causes of overproduction.png 960 × 720; 29 KB
 Cc-by-sa.png 403 × 141; 17 KB
 Ce marking.jpg 401 × 212; 26 KB
 Ce marking process.jpg 1,052 × 721; 56 KB
 Center of excellence.jpg 380 × 380; 22 KB
 Central traits.png 960 × 720; 43 KB
 Centralised vs decentralized organizational structure.png 960 × 720; 48 KB
 Channel width.png 702 × 537; 29 KB
 Classification of goals and functions.png 960 × 720; 27 KB
 Committed costs examples.png 960 × 720; 32 KB
 Company culture.png 960 × 720; 34 KB
 Company situation analysis.png 760 × 481; 66 KB
 Competitive position.png 960 × 720; 24 KB
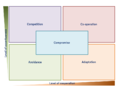
 Competitor-complementor map.png 960 × 720; 35 KB
 Conditions of decision making.png 738 × 613; 90 KB
 Consumer decision making process.png 810 × 593; 136 KB
 Contra entry.png 960 × 406; 14 KB
 Contractual relationships.png 798 × 489; 17 KB
 Control chart.jpg 652 × 407; 31 KB
 Convex production capacity curve.png 660 × 550; 10 KB
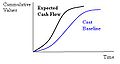 Cost Baseline.jpg 374 × 201; 9 KB
 Critical Path Method.png 1,014 × 1,002; 90 KB
 Crosby.jpg 200 × 254; 25 KB
 Cultural tourism.jpg 1,024 × 768; 155 KB
 Decision making errors and biases.png 960 × 720; 40 KB
 Decision table example.gif 702 × 231; 9 KB
 Decision table structure.gif 719 × 321; 3 KB
 Decision types in business.png 960 × 720; 48 KB
 Delegation principles.png 960 × 720; 32 KB
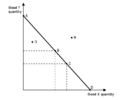
 Demand curve.jpg 425 × 384; 8 KB
 Design quality.jpg 690 × 519; 29 KB
 Design thinking.png 805 × 293; 71 KB
 Diagonal communication.png 1,024 × 621; 56 KB
 Differential cost.png 960 × 720; 18 KB
 Disambig.png 60 × 60; 2 KB
 Disruptive Innovation model.jpg 703 × 380; 52 KB
 Disruptive business.gif 820 × 527; 33 KB
 Divisional organizational structure.png 810 × 624; 58 KB
 Drawing1.png 2,513 × 561; 46 KB
 Drawing2.png 2,512 × 300; 30 KB
 Drawing3.png 2,512 × 300; 31 KB
 Drawing4.png 2,512 × 300; 29 KB
 EBK model.png 1,183 × 850; 76 KB
 EFE matrix.png 955 × 470; 31 KB
 Ecological factors affecting business.png 1,024 × 327; 58 KB
 Economic batch size.png 960 × 720; 39 KB
 Economic feasibility.png 1,024 × 637; 58 KB
 Economies of scale.png 753 × 655; 45 KB
 Effective works committee.png 960 × 720; 38 KB
 Elements of organizational culture.png 960 × 720; 19 KB
 Encyclopedia of management.png 590 × 80; 22 KB
 Equilibrium.jpg 778 × 536; 22 KB
 Ethical factors.png 416 × 370; 55 KB
 Evaluation of organizational culture.png 960 × 720; 31 KB
 Eve economic value of equity calculation.png 429 × 720; 17 KB
 Experience curve.png 754 × 655; 58 KB
 External environment.png 800 × 444; 38 KB
 Financial controlling activities.png 960 × 720; 35 KB
 Fishbein model.png 909 × 804; 78 KB
 Functional structure.png 641 × 282; 19 KB
 Functions of research.png 1,024 × 582; 80 KB
 Futures.jpg 501 × 295; 13 KB
 G Taguchi.gif 126 × 160; 18 KB
 Gary S. Becker.jpg 230 × 230; 7 KB
 German model of corporate governance.png 960 × 720; 24 KB
 Gert calculation.png 518 × 376; 17 KB
 Gert example.png 588 × 434; 22 KB
 Gert logical operators.png 541 × 665; 40 KB
 Gert loops.png 1,379 × 417; 21 KB
 Governance.png 640 × 493; 187 KB
 Gronroos.jpg 1,000 × 623; 74 KB
 Heijunka box.jpg 345 × 236; 15 KB
 Hersey and Blanchard model.png 666 × 645; 116 KB
 Hierarchy of effects model.png 936 × 767; 95 KB
 Hierarchy of strategies.png 930 × 654; 57 KB
 High involvement product.png 960 × 720; 23 KB
 Hofer matrix.png 861 × 601; 117 KB
 Hoshin kanri.jpg 548 × 312; 21 KB
 Hoshin matrix.jpg 650 × 471; 52 KB
 Hospitality product quality.png 960 × 720; 34 KB
 Hospitality services quality.png 710 × 531; 158 KB
 Hotel rating.png 202 × 186; 21 KB
 House of total quality.jpg 563 × 350; 29 KB
 Howard Sheth model.png 1,090 × 753; 120 KB
 IMF-lending chart.gif 520 × 477; 20 KB
 IMFheadq.jpg 500 × 395; 288 KB
 Innocvation vs creativity.png 960 × 720; 38 KB
 Input output tax.png 960 × 546; 35 KB
 Insurance intermediary.png 960 × 720; 70 KB
 Interim certificate and payments.png 960 × 720; 27 KB
 Internal transport.png 960 × 720; 49 KB
 Japanese model of corporate governance.png 960 × 720; 28 KB
 Juran.gif 120 × 160; 16 KB
 KAIZEN.jpg 639 × 444; 33 KB
 K Ishkawa.gif 120 × 171; 18 KB
 Kanodiagram.png 832 × 486; 71 KB
 Knowledge gap concept.jpg 632 × 365; 34 KB
 Korelacja Diagram.jpg 472 × 281; 13 KB
 Korelacja brak.jpg 471 × 283; 11 KB
 Korelacja dodatnia.jpg 471 × 281; 11 KB
 Korelacja ujemna.jpg 476 × 283; 12 KB
 Krzysztof Wozniak.jpg 800 × 932; 139 KB
 Lateral diversification.png 1,065 × 372; 46 KB
 Leavitt organization model.png 711 × 326; 86 KB
 Legal factors.png 353 × 374; 43 KB
 Lehman formula.png 960 × 383; 10 KB
 Levels of complexity.png 960 × 603; 47 KB
 Life cycle of fiat currency.png 960 × 720; 46 KB
 Line of credit types.png 960 × 720; 32 KB
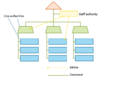 Line vs staff authority.png 960 × 720; 20 KB
 Linear organizational structure.png 671 × 321; 15 KB
 Linear production capacity curve.png 660 × 550; 10 KB
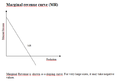 MR Curve.png 633 × 436; 13 KB
 Management by conflict.png 960 × 720; 25 KB
 Management by participation.png 960 × 720; 31 KB
 Management by projects.png 960 × 720; 26 KB
 Management by results.png 960 × 359; 16 KB
 Management of development.gif 644 × 411; 12 KB
 Management schools of thought.png 960 × 511; 19 KB
 Management styles authority vs freedom.png 749 × 720; 55 KB
 Marine tourism.jpg 1,024 × 683; 179 KB
 Marketing plan control process.png 1,279 × 885; 97 KB
 Marketing strategy elements.png 660 × 720; 17 KB
 Maslow hierarchy of needs.jpg 782 × 381; 47 KB
 McKinsey matrix.png 638 × 632; 112 KB
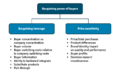
 Methods of restructuring.png 960 × 720; 35 KB
 Methods of strategic analysis.png 960 × 720; 36 KB
 Mfiles logo.png 180 × 66; 9 KB
 Minimax criterion.png 960 × 720; 39 KB
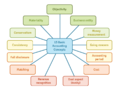
 Mobility barriers.png 339 × 234; 34 KB
 Modes of delivery.png 960 × 430; 21 KB
 Money emission.png 690 × 728; 77 KB
 Mountain tourism.jpg 1,024 × 683; 141 KB
 NAIRU-SR-and-LR.png 200 × 200; 8 KB
 Near and far environment.png 960 × 720; 35 KB
 Nicosia model of consumer behaviour.png 1,222 × 859; 141 KB
 Non-conformity management.png 292 × 720; 13 KB
 Normal distribution.jpg 507 × 383; 16 KB
 Objectives of the organization.png 1,073 × 810; 88 KB
 Opportunities.png 506 × 441; 60 KB
 Optimum size of order.png 960 × 720; 11 KB
 Organization of production.png 960 × 720; 22 KB
 Organizational dependencies.png 960 × 720; 25 KB
 Organizational structure.png 960 × 720; 30 KB
 PDCA.jpg 119 × 129; 5 KB
 Pareto chart.jpg 763 × 456; 64 KB
 Pdca-process-iso-dis-9001-2015.png 688 × 515; 254 KB
 Pest.jpg 590 × 260; 20 KB
 Picture 1.png 1,123 × 794; 67 KB
 Planning vs control.png 651 × 368; 58 KB
 Political factors.png 489 × 457; 80 KB
 Porter5.jpg 519 × 471; 25 KB
 Pricing strategies.png 865 × 368; 44 KB
 Product-life-cycle-stages-plc.jpg 584 × 476; 22 KB
 Production line.png 960 × 720; 28 KB
 Production process.jpg 672 × 274; 29 KB
 Project Lifecycle.gif 700 × 324; 8 KB
 Project evaluation methods.png 1,024 × 346; 64 KB
 Put.jpg 406 × 274; 14 KB
 Qfd1.jpg 471 × 707; 53 KB
 Qfd2.jpg 474 × 690; 71 KB
 Quality cost1.jpg 692 × 576; 67 KB
 Quality cost2.png 1,499 × 750; 86 KB
 Quality loss function.jpg 723 × 448; 40 KB
 Quality management development.jpg 998 × 588; 61 KB
 Quality management system-2015.png 1,159 × 896; 94 KB
 Quality of public administration.png 342 × 336; 55 KB
 Rating process example component model of performance rating.png 3,670 × 1,850; 69 KB
 Reddin box.png 994 × 892; 90 KB
 Religious tourism.jpg 1,024 × 768; 167 KB
 Research process.png 960 × 720; 35 KB
 Revenue center.png 960 × 720; 23 KB
 Risk management ISO31000.png 1,744 × 1,183; 90 KB
 Risk management process.jpg 922 × 445; 44 KB
 STEEPLE analysis.png 582 × 514; 49 KB
 STEEP analysis.png 595 × 514; 47 KB
 SWOT matrix.png 740 × 631; 98 KB
 SalesPotential.jpg 1,123 × 794; 42 KB
 Salience model.png 960 × 720; 44 KB
 Servqual gaps.png 622 × 468; 20 KB
 Shareholder value added.png 960 × 472; 23 KB
 Shewhart.gif 108 × 136; 4 KB
 Shipping process.png 960 × 451; 31 KB
 Short run equilibrium.png 456 × 295; 10 KB
 Significance of strategy.png 960 × 720; 35 KB
 Silvestro model.jpg 592 × 592; 30 KB
 Simple Burndown Chart.png 795 × 453; 28 KB
 Six sigma.jpg 507 × 383; 12 KB
 Slawomir Wawak 2.jpg 300 × 300; 58 KB
 Social and cultural factors affecting business.png 1,024 × 397; 60 KB
 Staff structure.png 805 × 344; 20 KB
 State administration features.png 960 × 720; 39 KB
 Statement of profit and loss.png 960 × 720; 24 KB
 Step-down.jpg 507 × 369; 24 KB
 Step fixed cost.png 597 × 353; 4 KB
 Strategic Business Units.png 790 × 606; 59 KB
 Strategic controlling.png 960 × 720; 23 KB
 Strategic cost management process.png 960 × 720; 36 KB
 Strategic groups map.png 960 × 720; 36 KB
 Strategic management functions.png 930 × 1,001; 98 KB
 Strategic management model.gif 517 × 675; 11 KB
 Strategic options.png 960 × 532; 31 KB
 Strategic planning process.gif 625 × 877; 48 KB
 Strategy wheel.jpg 565 × 430; 35 KB
 Strauss-kahn.jpg 900 × 704; 68 KB
 Strengths.png 321 × 332; 15 KB
 Structure follows strategy.png 960 × 380; 28 KB
 Structure of contra deal.png 960 × 720; 36 KB
 Subsidiary account.png 960 × 720; 57 KB
 Supply logistics subsystem.png 960 × 371; 14 KB
 Swap2.jpg 648 × 77; 7 KB
 System approach to project management.png 960 × 720; 37 KB
 Systemic approach to change.png 502 × 209; 16 KB
 TOWS TimeDimension.png 1,094 × 665; 47 KB
 TOWS matrix.png 1,020 × 918; 133 KB
 TOWS procedure.png 1,165 × 1,134; 163 KB
 Taxes.png 640 × 475; 229 KB
 Team members selection.png 960 × 720; 38 KB
 Technological factors.png 358 × 340; 24 KB
 Test validity.png 2,050 × 1,000; 31 KB
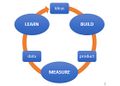 The Build–Measure–Learn loop.jpg 558 × 398; 25 KB
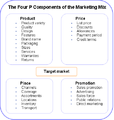 The Four P Components.png 469 × 495; 19 KB
 Threats.png 425 × 381; 15 KB
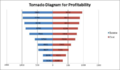 Tornado Diagram for Profitability – example.png 380 × 222; 35 KB
 Tourism types.png 960 × 479; 17 KB
 Types of Doji.jpeg 1,024 × 512; 58 KB
 Types of Doji.png 1,024 × 512; 76 KB
 Types of quality certificates.png 960 × 720; 35 KB
 Types of quality parameters.png 960 × 720; 31 KB
 Types of segmented pricing.png 980 × 462; 61 KB
 Uncertainty avoidance.png 571 × 332; 44 KB
 Uninsurable risk.png 960 × 720; 33 KB
 Unity of command vs direction.png 960 × 720; 15 KB
 Urban tourism.jpg 1,024 × 895; 237 KB
 Uwaga.png 70 × 65; 4 KB
 Valid executed or executory consideration.png 960 × 720; 24 KB
 Value stream mapping symbols.jpg 831 × 664; 48 KB
 Veblencurve.png 782 × 621; 48 KB
 Vendor managed inventory system.png 960 × 720; 37 KB
 Vertical communication.png 1,024 × 637; 53 KB
 Vertical diversification.png 683 × 722; 46 KB
 WE Deming.jpg 154 × 181; 11 KB
 Weaknesses.png 447 × 331; 29 KB
 Whywhyanalysis.png 936 × 281; 18 KB
 Work improvement.png 813 × 717; 18 KB
 Work sample tests.png 960 × 317; 26 KB
 Wykres.png 897 × 501; 8 KB
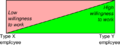 X Y employee.png 681 × 258; 26 KB


