McKinsey matrix
| McKinsey matrix |
|---|
| See also |
McKinsey matrix (other names: matrix of product attractiveness, market attractiveness matrix, GE matrix) dates back to the seventies. Is used to determine the success factors of the company in the form of industry attractiveness and competitive position within the industry.
Assumptions used for creating McKinsey/GE matrix
The main assumptions of the McKinsey matrix structure:
- company should operate in the sector more attractive, while eliminating the products from the less attractive,
- company should invest in products with a strong competitive position, and withdraw from those in which its competitive position is weak.
The method is also called McKinsey nine-field analysis (9W analysis) of the company's production portfolio. This matrix consists of two variables:
- attractiveness of the industry,
- assessment of the competitive position and financial strength of the company.
Stages of evaluation of attractiveness of the industry
- Identification of criteria for the attractiveness of the industry and the market size.
- Weighing of ratings (sum of the weights of all criteria is 1).
- Evaluation of each industry on scale from 1 to 5 meaning: 1-unattractive, 5-industry very attractive.
- Interpretation of the final result of the attractiveness evaluation.
Stages of evaluation of competitive position
Assessment of the competitive position of the company has following stages:
- Identification of the factors of success of the company.
- Weighting of relative factor importance.
- Evaluation of competitiveness on scale from 1 to 5 meaning: 1-weak competitive position, 5-strong position.
- Interpretation of the estimated ratings.
Principles for GE/McKinsey matrix interpretation
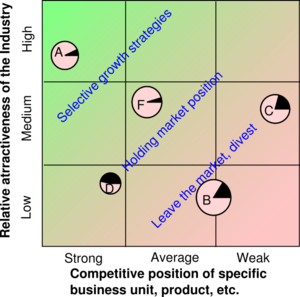
On the Y axis, which determines the level of attractiveness, we denote the attractiveness of each of the industries. X-axis mark strategic positions of the company. The intersection of the two dimensions determine the point, which is the centre of a circle, meaning the company position (fig. 1.).
Circle size is dependent on the size of the production. Inside the circle segments are drawn, which determine the size of the market share of the product. The distribution of products in the matrix informs us about the strategy that should be used.
Advantages and disadvantages of GE/McKinsey matrix
Advantages:
- flexibility in assessing the attractiveness of the industry,
- greater possibility of balancing a portfolio of production.
Disadvantages:
- subjective criteria for evaluation (assessment is more focused on the present and not the future competitive position of the company).
References
- Amatulli, Cesare, Tiziana Caputo, and Gianluigi Guido. Strategic analysis through the general electric/McKinsey Matrix: An application to the Italian fashion industry, International Journal of Business and Management 6.5 (2011): 61.
- Luthwig, M. (2015). A Multi-model tool for subsidiary management to measure market attractiveness, subsidiary strength, exploration, and exploitation.
- Proctor, R. A., & Kitchen, P. J. (1990). Strategic planning: An overview of product portfolio models. Marketing Intelligence & Planning, 8(7), 4-10.
