Project status report: Difference between revisions
Ceopediabot (talk | contribs) m (typos fixed: don’t → don't (3), it’s → it's (3), ’s → 's, of the of the → of the) |
(The LinkTitles extension automatically added links to existing pages (<a target="_blank" rel="noreferrer noopener" class="external free" href="https://github.com/bovender/LinkTitles">https://github.com/bovender/LinkTitles</a>).) |
||
| Line 40: | Line 40: | ||
=== Cumulative Report === | === Cumulative Report === | ||
This report type may contain similar sort of [[information]] like current report, but it'll cover periods from the beginning of the project to the last completed period. It enables project manager to present trends that can deliver senior management greater value than information from current report as they are a natural input for forecasting project future and deciding whether project is in risk or everything is fine<ref>Wysocki R. K. (2011)., ''Effective Project Management: Traditional, Agile, Extreme, Seventh Edition'', John Wiley & Sons, Inc., Indianapolis, p.269-270</ref>. | This report type may contain similar sort of [[information]] like current report, but it'll cover periods from the beginning of the project to the last completed period. It enables project manager to present trends that can deliver senior management greater value than information from current report as they are a natural input for [[forecasting]] project future and deciding whether project is in risk or everything is fine<ref>Wysocki R. K. (2011)., ''Effective Project Management: Traditional, Agile, Extreme, Seventh Edition'', John Wiley & Sons, Inc., Indianapolis, p.269-270</ref>. | ||
=== Exception Report === | === Exception Report === | ||
| Line 90: | Line 90: | ||
[[File:Simple_Burndown_Chart.png|600px|center|thumb|Fig. 1 Title (source: Burndown Chart with execution-based forecast)]] | [[File:Simple_Burndown_Chart.png|600px|center|thumb|Fig. 1 Title (source: Burndown Chart with execution-based forecast)]] | ||
Another modification that can be done to burndown chart is taking into account so called cone of uncertainty when defining original plan. It can be expressed in plotting three plan curves: optimistic, optimal and pessimistic. This approach – if accepted by project sponsors – can give project team some buffers on one hand, but on the other it defines some tolerance-like guidelines than can be used to implement exceptions reporting or exceptions-based escalations<ref>Kenneth S. R. (2012)., ''Essential Scrum : A Practical Guide to the Most Popular Agile [[Process]]'', Pearson [[Education]], Inc., New Jersey, p.327</ref>. | Another modification that can be done to burndown chart is taking into account so called cone of uncertainty when defining original plan. It can be expressed in plotting three plan curves: optimistic, optimal and pessimistic. This approach – if accepted by project sponsors – can give [[project team]] some buffers on one hand, but on the other it defines some tolerance-like guidelines than can be used to implement exceptions reporting or exceptions-based escalations<ref>Kenneth S. R. (2012)., ''Essential Scrum : A Practical Guide to the Most Popular Agile [[Process]]'', Pearson [[Education]], Inc., New Jersey, p.327</ref>. | ||
[[File:Advanced_Burndwon_Chart.png|600px|center|thumb|Fig. 1 Title (source: Burndown Chart with with cone of uncertentity)]] | [[File:Advanced_Burndwon_Chart.png|600px|center|thumb|Fig. 1 Title (source: Burndown Chart with with cone of uncertentity)]] | ||
Revision as of 00:57, 21 January 2023
Project status report is controlling tool that allow you to quickly identify any deviations from the plan. Report's audience frequently consist on people high in hierarchy, who need to read many of that documents, so it's very important to keep them short and concise. The form of reports may be different. They are usually presented using tables and charts, as this makes them fast to read and digest[1].
Types of status reports exists
There are several types of project status reports, the most commonly used are[2]:
- Current Period Report,
- Cumulative Report,
- Exception Report,
- Stoplight Report,
- Variance Report.
The type of report used for given project may depend on various factors, e.g.[3]:
- project management methodology used in the project or organization,
- recipients of the report,
- context of presenting the report,
- organizational culture,
- current needs of the organization.
Each report type has been described in following paragraphs.
Current Period Report
This type of status report is based on tasks, events, risks and other project parameters that happened or changed during last completed reporting period. For example, it will inform about[4]:
- task started, ongoing and finished during last period,
- important events or issues that happened during last reporting period,
- all risk management plan modification that occurred during last reporting period.
Cumulative Report
This report type may contain similar sort of information like current report, but it'll cover periods from the beginning of the project to the last completed period. It enables project manager to present trends that can deliver senior management greater value than information from current report as they are a natural input for forecasting project future and deciding whether project is in risk or everything is fine[5].
Exception Report
The only information included in this type of report are significant deviations from the plan. Such reports are most often prepared for senior management, and their main purpose is to reduce unnecessary content and provide the most relevant information, which can be quickly read and interpreted[6].
Stoplight Report (traffic light system)
In this kind of report, a project condition is marked with a color sign on its first page:
- green color means that everything is going according to plan,
- yellow color means that there are some delays in the project,
- red color means an emergency situation that requires immediate intervention.
Following pages may contain elements from other types of reports and details of repair plan and issues causes if a status is yellow or red.
This type of status report is very effective and universal. People that are only briefly interested in a project can satisfy their information needs just checking a project color. Senior management can also be satisfied with just checking a color unless it's red or yellow for many consecutive periods. People that are closer to the project may always read the whole report, but if they are short on time and the report is green, they can easily read it later and don't stress about it[7].
Variance Reports
This type of report shows the differences between results planned and achieved so far. There are two ways of presentation used in this report type.
- Numerical statement - all numerical data is presented in three columns: actual values, planned values, variance values.
- Chart that contains two curves in different colors that adequately represent planned and actual values. The distance between that curves represents the deviation.
If there are significant deviations from planned quantities, it is advisable to describe their causes and present a repair plan that will bring a project back on track[8].
Graphical reporting tools
Presenting reports graphically is the most effective. Thanks to this we can read the conclusions from the report in a very short time and in an easy way. The graphical reporting tools used are[9]:
- Gantt Chart,
- Stoplight Report,
- Burndown Chart,
- Burnup Chart,
- Milestone Trend Chart,
- Earned Value Analysis.
Gantt Chart
Gantt chart is one of the most basic planning tools that has been used by project managers for more than 100 years already. It presents all tasks planned in a project and their start and end dates. It is a natural candidate to illustrate project progress, because the only information that needs to be added to the original diagram is tasks completion score. Most of the project management software that supports Gantt chart enables project manager to indicate tasks progress, so it is easy to add the chart to project status report[10].
Burndown Chart
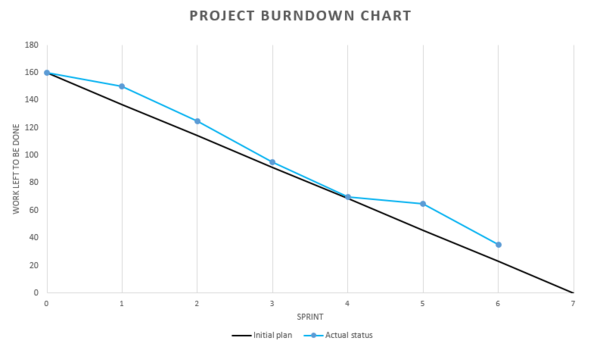
Burndown charts are very popular in Agile IT environments. Their main goal is to visualize the amount of work left to be done in a project. They can be classified as cumulative reports and deviation reports as they usually show actual status compared to the original plan. There are four elements that are always present on a burndown chart:
- Vertical axis describes amount of work left to be done;
- Horizontal axis is about time – measured with iteration/sprint number;
- Original plan curve presenting initial forecast of how much work will be left to be done after each iteration;
- Actual status curve that is updated after each iteration to show factual amount of work left to be done.
The most common unit in which the remaining work is defined is Story Point that originates in Agile, but it could be man-day or any other unit that describes the amount of work.
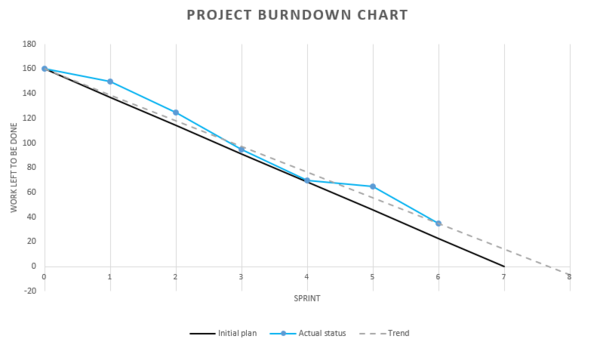
There are many modifications and improvements that can be applied to burndown chart. The most basic one is an addition of trend line that can help report receiver understand when the scope will be delivered is average delivery speed won't change.
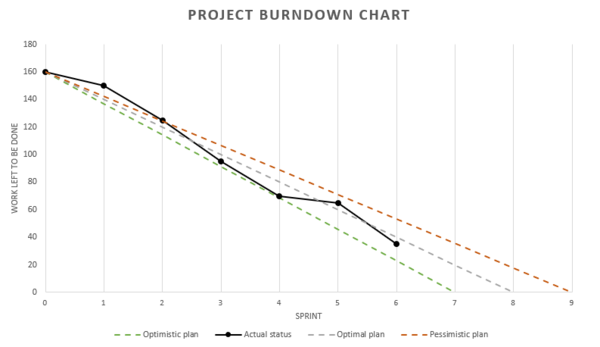
Another modification that can be done to burndown chart is taking into account so called cone of uncertainty when defining original plan. It can be expressed in plotting three plan curves: optimistic, optimal and pessimistic. This approach – if accepted by project sponsors – can give project team some buffers on one hand, but on the other it defines some tolerance-like guidelines than can be used to implement exceptions reporting or exceptions-based escalations[11].
Burnup Charts
Burnup chart is very similar to burndown chart. The only difference is that Burndown chart represents an amount of work that remains to be done in a project, while burnup chart shows how much work has been done already. As all plots on this chart start in 0, a project goal line is always drawn to show how much work is expected to be done.
Due to the fact that burndown and burnup charts are so similar, one of them is frequently chosen based on individual taste. Nevertheless, some argue that burnups allow more natural scope changes tracking and visualizing of different scope levels (e.g. must have, should have, etc.)[12].
Monitoring the status of the project according to PMBoK® Guide
Monitoring and controlling the work in a project is one of the processes defined in PMBoK® standard. It should be carried out throughout the duration of the project. According to the standard, monitoring and controlling project status can include following areas:
- scope of the project,
- communications,
- risks,
- procurements,
- stakeholder engagement,
- schedule,
- costs,
- quality.
As these are areas that can, but don't have to be included, every project manager have to consider which of them are important in the project and should include relevant information about them in project status report. Correct identification and reporting may bring important input to other processes like[13]:
- managing a project team,
- managing communication,
- controlling risks,
- controlling procurements.
Footnotes
- ↑ Wysocki R. K. (2011).,Effective Project Management: Traditional, Agile, Extreme, Seventh Edition, John Wiley & Sons, Inc., Indianapolis, p.268-269
- ↑ Wysocki R. K. (2011)., Effective Project Management: Traditional, Agile, Extreme, Seventh Edition, John Wiley & Sons, Inc., Indianapolis, p.268-269
- ↑ Wysocki R. K. (2011)., Effective Project Management: Traditional, Agile, Extreme, Seventh Edition, John Wiley & Sons, Inc., Indianapolis, p.268-269
- ↑ Wysocki R. K. (2011)., Effective Project Management: Traditional, Agile, Extreme, Seventh Edition, John Wiley & Sons, Inc., Indianapolis, p.269
- ↑ Wysocki R. K. (2011)., Effective Project Management: Traditional, Agile, Extreme, Seventh Edition, John Wiley & Sons, Inc., Indianapolis, p.269-270
- ↑ Wysocki R. K. (2011)., Effective Project Management: Traditional, Agile, Extreme, Seventh Edition, John Wiley & Sons, Inc., Indianapolis, p.270
- ↑ Wysocki R. K. (2011)., Effective Project Management: Traditional, Agile, Extreme, Seventh Edition, John Wiley & Sons, Inc., Indianapolis, p.270-271,277
- ↑ Wysocki R. K. (2011)., Effective Project Management: Traditional, Agile, Extreme, Seventh Edition, John Wiley & Sons, Inc., Indianapolis, p.271-273
- ↑ Wysocki R. K. (2011)., Effective Project Management: Traditional, Agile, Extreme, Seventh Edition, John Wiley & Sons, Inc., Indianapolis, p.276-287
- ↑ Wysocki R. K. (2011)., Effective Project Management: Traditional, Agile, Extreme, Seventh Edition, John Wiley & Sons, Inc., Indianapolis, p.277
- ↑ Kenneth S. R. (2012)., Essential Scrum : A Practical Guide to the Most Popular Agile Process, Pearson Education, Inc., New Jersey, p.327
- ↑ Kenneth S. R. (2012)., Essential Scrum : A Practical Guide to the Most Popular Agile Process, Pearson Education, Inc., New Jersey, p.328
- ↑ Project Management Institute (2013)., A Guide to the Project Management Body of Knowledge (PMBOK Guide) - 5th Edition, Project Management Institute, Inc., Pensylwania, p.86-94
References
- Kenneth S. R. (2012)., Essential Scrum : A Practical Guide to the Most Popular Agile Process, Pearson Education, Inc., New Jersey
- Project Management Institute (2013)., A Guide to the Project Management Body of knowledge|Body of Knowledge (PMBOK Guide) - 5th Edition, Project Management Institute, Inc., Pensylwania
- Schwaber K., Sutherland J (2017)., The Scrum Guide
- Wysocki R. K. (2011)., Effective Project Management: Traditional, Agile, Extreme, Seventh Edition, John Wiley & Sons, Inc., Indianapolis
Author: Paulina Sosińska


